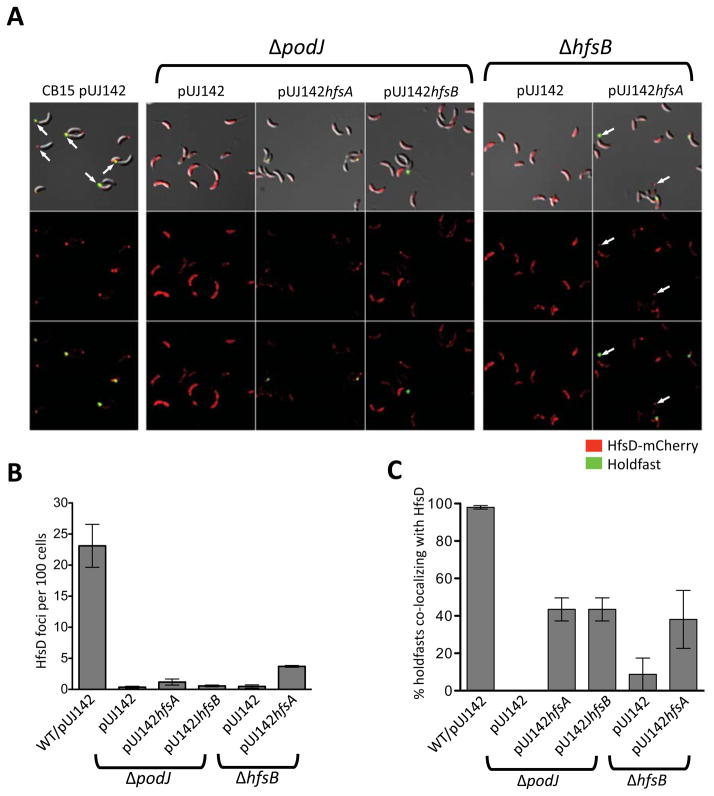
Figure 10.
HfsD-mCherry localization pattern in ΔpodJ and ΔhfsB mutants in which holdfast export proteins were overexpressed. (A) Strains expressing HfsD-mCherry as the only copy of HfsD. Top row: DIC and fluorescence overlay (both channels). Middle row: HfsD-mCherry fluorescence images. Bottom row: HfsD-mCherry and WGA-Alexa Fluor 488 fluorescence overlay. Contrast was adjusted similarly for all fluorescence images for best viewing of foci. Arrows point out HfsD foci located at the tip of the stalk. (B) Foci as detected and quantified using ImageJ. Foci were enumerated in 2 to 5 samples for each strain and compared to the number of cells estimated to be in the sample by ImageJ. The estimated number of cells ranged from about 175 to 2,800 cells (with most samples having over 400 cells). (C) The percentage of total holdfasts that co-localized with HfsD-mCherry foci for each strain.

