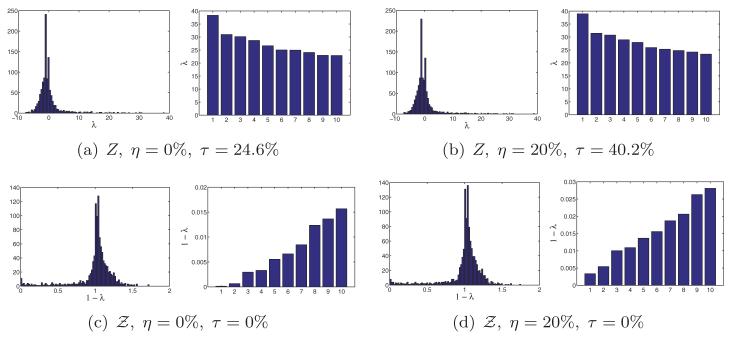
Fig. 5.
Histogram of all eigenvalues and bar plot of the top ten eigenvalues of Z and for the U.S. cities graph with ρ = 0.032 (deg = 19) and various noise levels η. The resulting error rate τ is the percentage of patches whose reflection was incorrectly estimated. To ease the visualization of the eigenvalues of , we choose to plot , because the top eigenvalues of tend to pile up near 1, so it is difficult to differentiate between them by looking at the bar plot of .

