
Figure 3. .
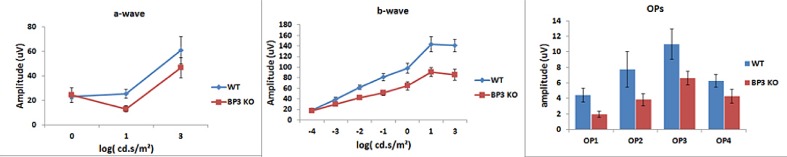
IGFBP-3 KO mice have reduced ERG responses (B-wave and oscillatory potentials) compared to wild-type. Mean ERG amplitudes for the IGFBP-3 KO and wild-type mice. Left is the A-wave, middle represents the B-wave, and the right is the amplitudes for the oscillatory potentials. N = 6 mice in each group.