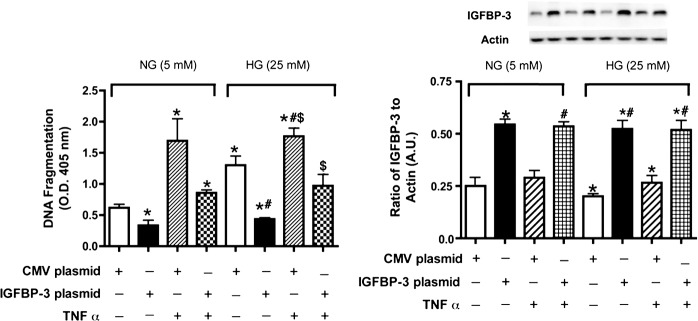
Figure 9. .

Cell death measurements in REC after TNF-α or IGFBP-3 plasmid transfection. (A) is ELISA results for the cell death ELISA in REC cultured in normal (5 mM) and high (25 mM) glucose, and TNF-α (5 ng/mL, 30 minutes) and/or transfected with CMV plasmid (control) or IGFBP-3 nonbinding plasmid. (B) Western blot results for IGFBP-3 following the same treatments. Data are presented as fold change from NG untreated. A representative blot is provided at the top. *P < 0.05 versus NG NT; #P < 0.05 versus HG NT; $P < 0.05 versus HG + 49b treatment. N = 3 for all groups.
