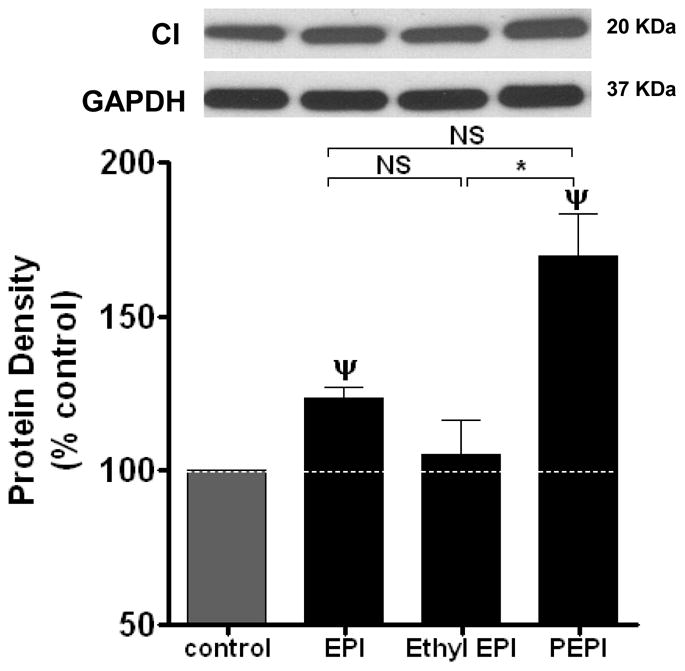
Figure 8. Effects of EPI, Ethyl EPI and PEPI on BCAEC mitochondrial complex I protein levels.

BCAEC were treated with either vehicle (control), 100 nmol/L EPI, 0.01 nmol/L Ethyl EPI or 0.01 nmol/L PEPI for 48 h. Western blots were probed with specific antibodies against complex I (CI). EPI; (−)-epicatechin, Ethyl EPI; 3′-O-ethyl (−)-epicatechin, PEPI; 3, 3′, 4′, 5, 7-O-penta-acetyl (−)-epicatechin. Values were normalized by arbitrarily setting the densitometry of control levels to 100. Values are mean ± SEM; n=3 per treatment. *p<0.01, ψp<0.01 vs. control.
