
Figure 4.
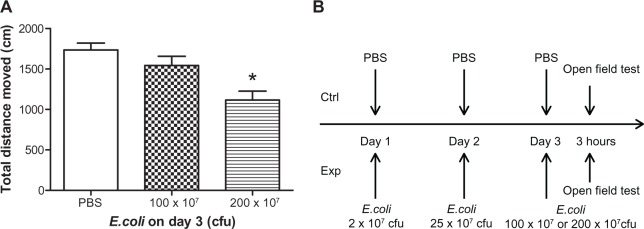
Open field activity following three days of repeated E. coli challenge.
Notes: (A) Mean total distance moved in the open field 3 hours after different concentrations of E. coli injections on day 3 in male mice. All E. coli treated mice received 2 × 10⁷ E. coli on day 1 and 25 × 107 E. coli on day 2. Control mice received PBS for 3 days. Bars represent group means ± SEM. *Indicates a significant difference compared with PBS control group (P < 0.05). (B) Schematic of the 3 day experimental design.
Abbreviations: cfu, colony forming unit; Ctrl, control; Exp, experimental animals; E. coli, Escherichia coli; PBS, phosphate buffered saline; SEM, standard error of the mean.