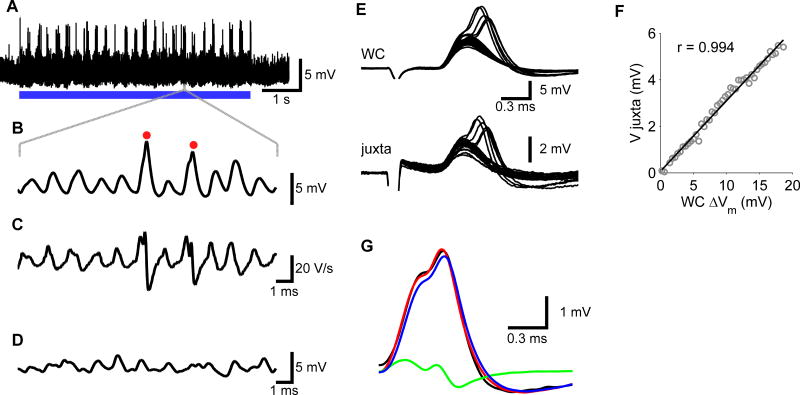
Figure 2. Whole-cell recordings in MSO.
(A–D) shows an in-vivo whole cell recording; (EG) illustrates the relation between a juxtacellular and a whole-cell recording obtained from a paired recording in brainstem slices. (A) Response to a 700/704-Hz, 40-dB-SPL binaural beat from an MSO neuron with a CF of 790 Hz. Resting membrane potential was −60 mV. (B) Short segment of the trace shown in (A). Two action potentials are marked by red dots. (C) Time derivative of the trace shown in (B), illustrating the faster repolarization phase of action potentials. (D) Segment of spontaneous activity of the same cell. (E) Simultaneous whole-cell and juxtacellular recordings of principal neuron in MSO slice showing EPSPs evoked from ipsilateral afferent stimulation, which in some cases triggered APs. (F) Relation between juxtacellular and intracellular peak EPSP amplitudes. Solid line shows line fit (r = 0.994). (G) The juxtacellularly recorded EPSP (black trace) can be well approximated by the sum (red trace) of a scaled version of the membrane potential (blue trace; resistive coupling constant 298 mV/V) and a scaled version of the time derivative of the membrane potential (green trace; capacitive coupling constant 8.2 μV/V/s).

