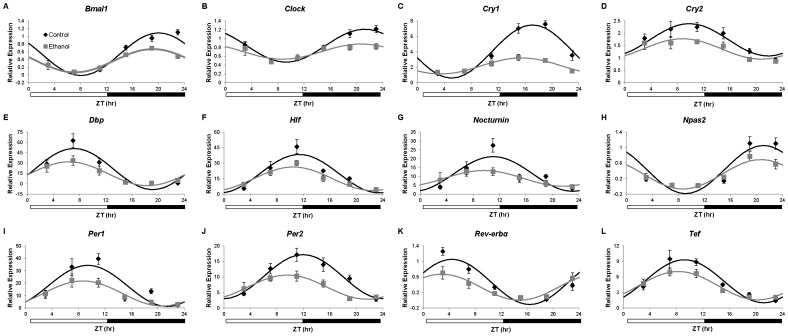
Figure 2. Expression of clock genes in the liver of C57BL/6J mice.
Gene expression of A) Bmal1, B) Clock, C) Cry1, D) Cry2, E) Dbp, F) Hlf, G) Nocturnin, H) Npas2, I) Per1, J) Per2, K) Rev-erbα, and L) Tef in liver from mice fed control (♦) or ethanol-containing (grey square) diets was determined using real-time quantitative PCR. Expression levels were normalized to the Gapdh housekeeping gene and are displayed as fold-change from a single control mouse. Cosinor analysis for curve fitting was performed using the nonlinear regression module in SPSS. Cosinor analysis results are included in Table 1. Data are presented as mean ± SEM for n = 4–6 control and ethanol-fed mice at each time point.

