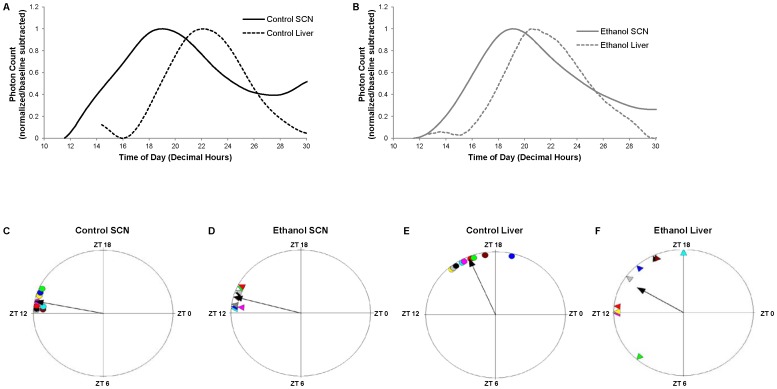
Figure 4. PER2::LUC expression in SCN and liver tissue explants.
Representative traces of PER2::LUC bioluminescence in liver and SCN are shown for a pair-fed A) control and B) ethanol-fed mouse. Peak phases of PER2::LUC expression in C–D) SCN and E–F) liver tissue cultures from individual control (•) and ethanol-fed (▴) mice are shown on the first full cycle following culture. Corresponding colors between ethanol-fed and control mice indicate those that were pair-fed. Further, correspondingly colored shapes between SCN and liver indicate that those tissues were obtained from the same mouse. The black arrow indicates the mean phase vector of the samples, where length is inversely proportional to the phase variance, and the direction indicates timing relative to the previous light cycle in LD. The plots were generated using Oriana 3 software. Data represent results from n = 9 control and 9 ethanol-fed mice.

