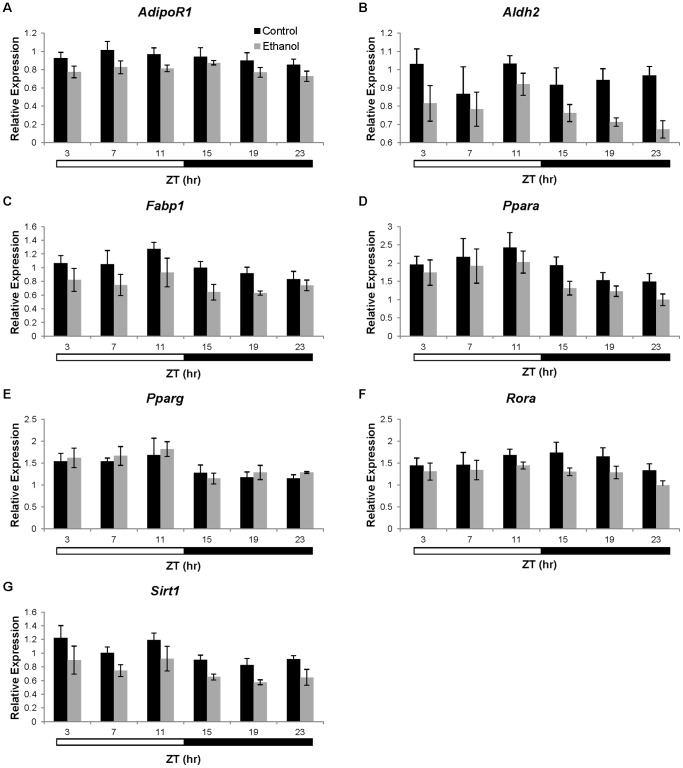
Figure 5. Expression of non-oscillating metabolism genes in the liver of C57BL/6J mice.
Gene expression of A) Adipor1, B) Aldh2, C) Fabp1, D) Ppara, E) Pparg, F) Rora, and G) Sirt1 was determined in liver from mice fed control (▪) or ethanol-containing (grey square) diets. Expression was normalized to the Gapdh housekeeping gene and is represented as fold-change compared to a single control mouse. Two-way ANOVA was used to determine significant effects of time and/or treatment on gene expression. Data are presented as mean ± SEM for n = 4–6 control and ethanol-fed mice at each time point.

