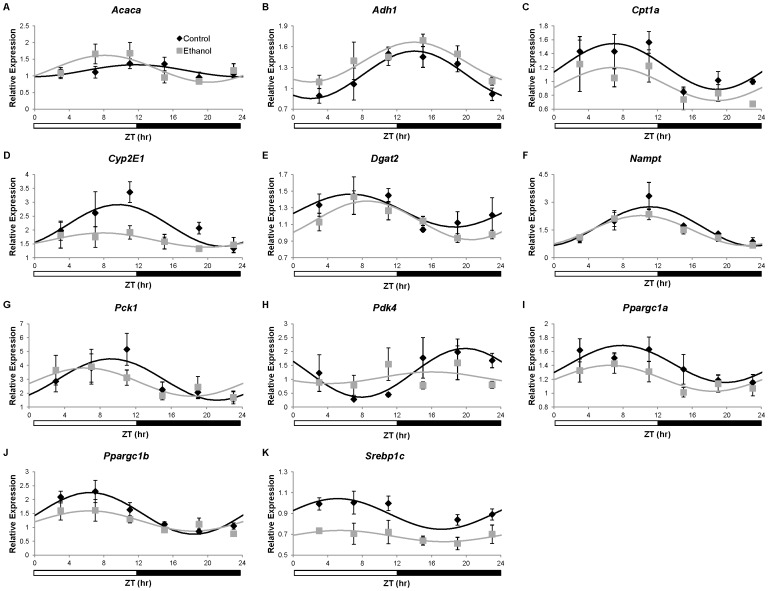
Figure 6. Expression of oscillating metabolic genes in the liver of wild-type C57BL/6J mice.
Gene expression of A) Acaca, B) Adh1, C) Cpt1a, D) Cyp2e1, E) Dgat2, F) Nampt, G) Pck1, H) Pdk4, I) Ppargc1a, J) Ppargc1a, and K) Srebp1c in livers from mice fed control (♦) or ethanol-containing (grey square) liquid diets was determined using real-time quantitative PCR. Expression levels were normalized to the Gapdh housekeeping gene and are displayed as fold-change from a single control mouse. Cosinor analysis for curve fitting was performed using the nonlinear regression module in SPSS. Cosinor analysis results are included in Table 3. Data are presented as mean ± SEM for n = 4–6 control and ethanol-fed mice at each time point.

