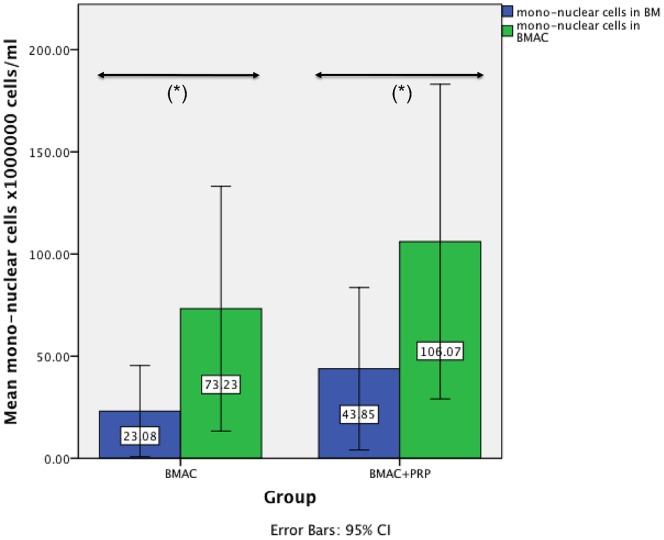
Figure 2. Mean mononuclear cell count.
The mean mononuclear cell count of both treatment groups (BMAC and BMAC+PRP) in bone marrow (BM) and bone marrow aspiration concentrate (BMAC). In the BMAC group there was a 3.17 (p = 0.021) fold increase of mononuclear cells in BMAC compared to BM, and in the BMAC+PRP a 2.42 (p = 0.006) fold increase of the mononuclear cells.

