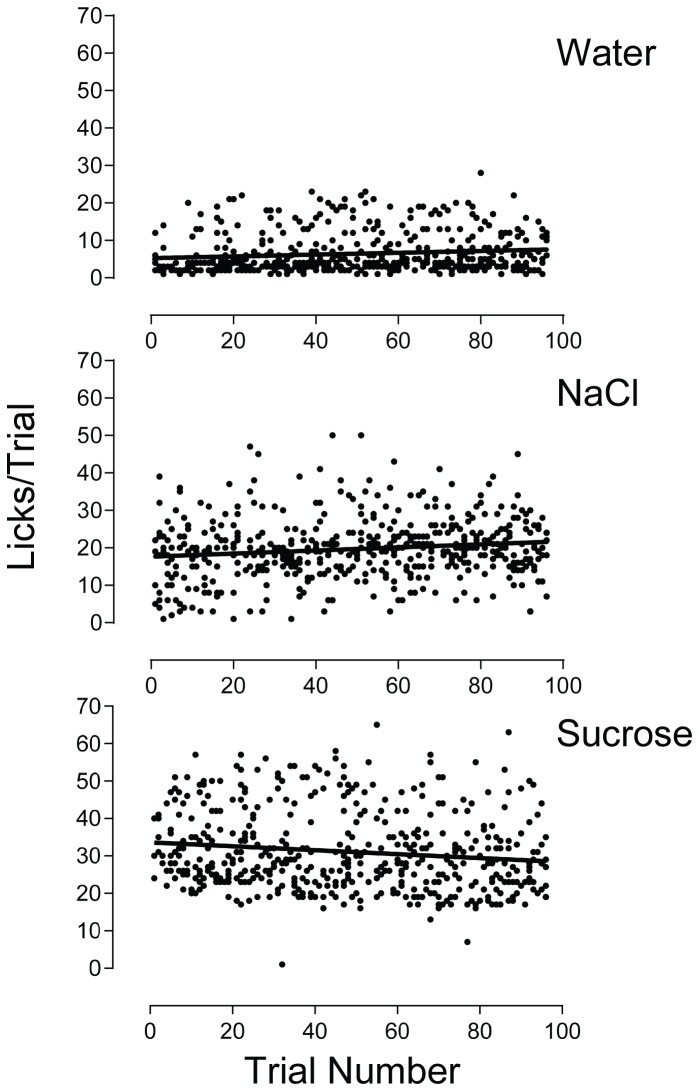
Figure 5. Relationship Between Lick Rates and Trial Number for Water, Sucrose, and NaCl.
Data points are licks per trial plotted according to their corresponding trial number. All data in the plots were generated by 4 rats across four training sessions in which water, 100 mM sucrose, and 100 mM NaCl each were presented in 32 trials per session (thus, 4 rats x 32 trials x 4 sessions = 512 data points for each tastant.) The lines within the plots represent the results of the linear regression.

