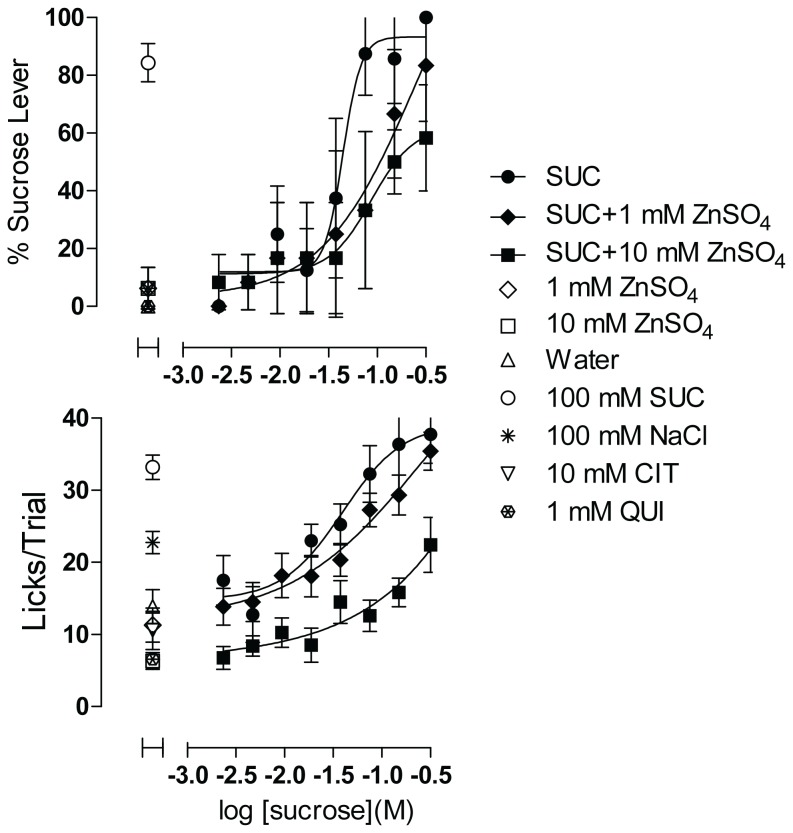
Figure 9. Effect of ZnSO4 on Sucrose Concentration–response Function.
Each concentration of sucrose plus ZnSO4 was dispensed in 3 wells, and of sucrose alone in 2 wells, per plate; controls were dispensed in 4-6 wells each per plate (See Figure S7 for plate configuration corresponding to the experiment illustrated in Figure 9). Upper panel shows sweet taste quality plotted as percent of responses made on the sucrose lever. Lower panel shows concentration–response function for palatability plotted as mean licks per trial. Data are plotted as mean of responses averaged across 4 rats. Error bars are SEM. SUC = sucrose, CIT = citrate, QUI = quinine. Data are representative of 3 equivalent experiments.

