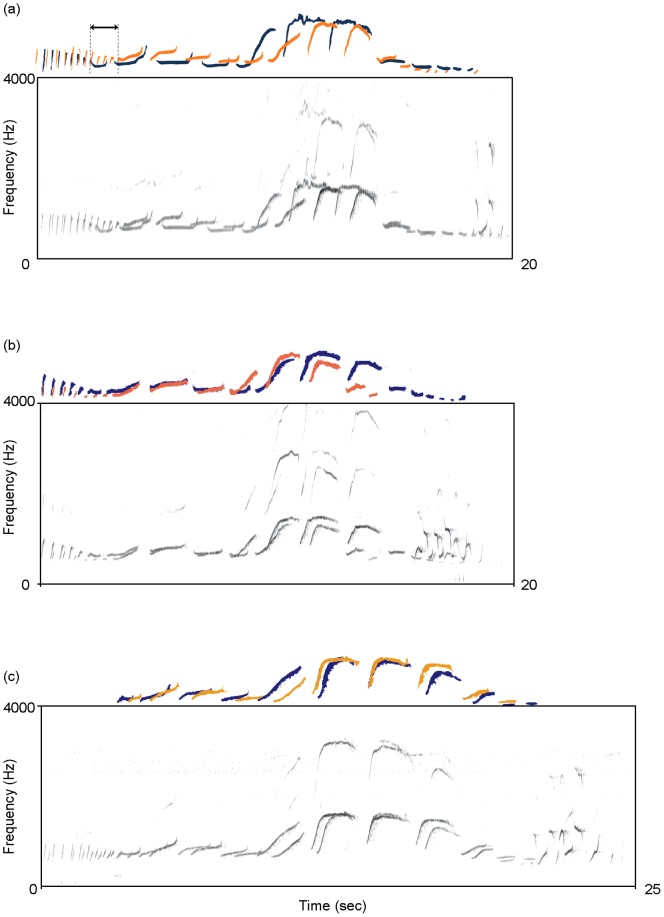
Figure 2. Sonograms of mother-daughter co-singing.
The mother and daughter pitch contours are illustrated above the sonograms in blue and orange, respectively. The arrow represents the onset time lag between mother and daughter songs. Sound files of those examples are available in the electronic supplementary material. (Sound S1) co-singing of B group (similarity index = 0.253); (Sound S2) H group (0.398); and (Sound S3) Z group (0.551).

