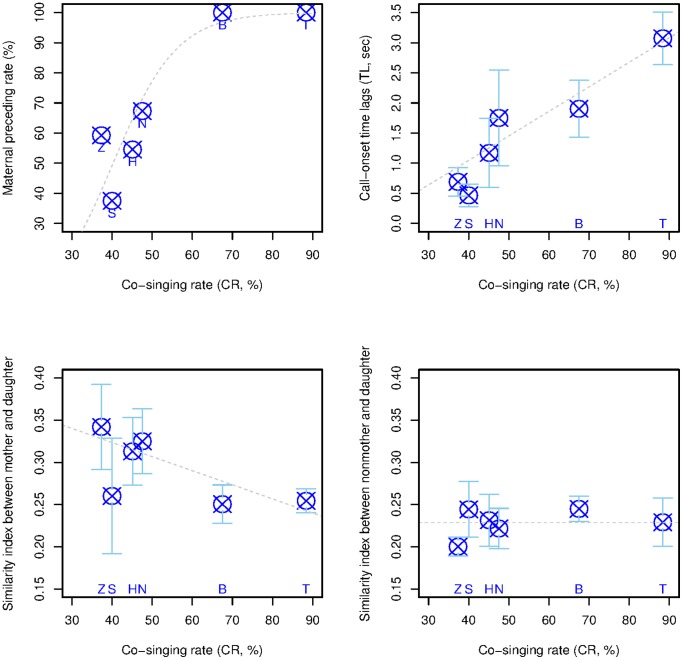
Figure 3. Behavioral and acoustic variables analyzed with co-singing rates.
(a) Maternal preceding rates (MPRs) plotted for co-singing rates (CRs) for 6 groups. Open circles with crosses indicate the percent proportion of duet where mothers preceded the great call utterance of daughters for each group. The regression line was plotted using coefficients of estimated GLMMs using a binomial error distribution with a logit link function (for the model terms, see the statistical procedure in methods section). (b) Call onset time lags (TLs) when a mother initiated the duet plotted for co-singing rates (CRs) for 6 groups. Open circles with crosses indicate the group means, and error bars represent 95% confidence intervals. The regression line was plotted using coefficients of estimated GLMMs using a Gaussian error distribution with an identity link function. (c) Mother-daughter similarity indices at the time of co-singing (MDco-singing) plotted for co-singing rates (CRs) for 6 groups. Open circles with crosses indicate the group means, and error bars represent 95% confidence intervals. The regression line was plotted using coefficients of estimated GLMMs using a Gaussian error distribution with an identity link function. See Table S2 for detailed results of similarity index. (d) Similarity indices between non-mothers and daughters (MDnonmohter) plotted for co-singing rates (CRs) for 6 groups. Open circles with crosses indicate the group means, and error bars represent 95% confidence intervals. The regression line was plotted using coefficients of estimated GLMMs using a Gaussian error distribution with an identity link function. See Table S2 for detailed results of similarity index.

