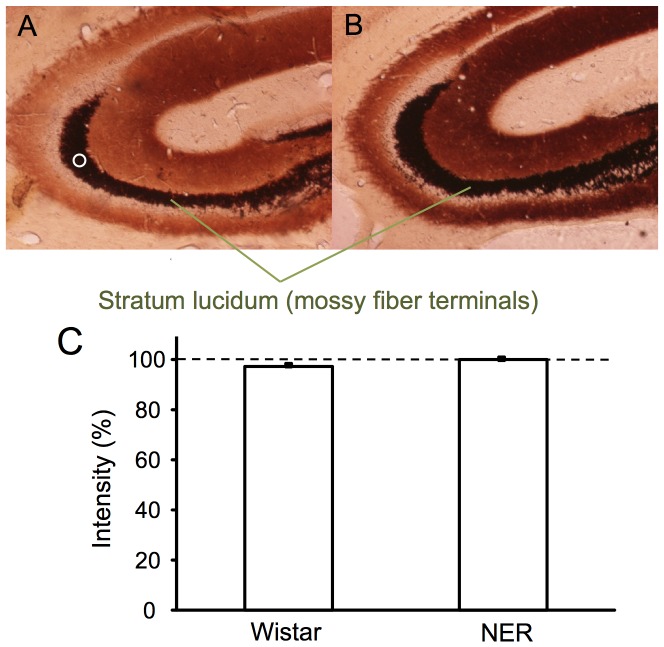
Figure 1. Timm’s staining in the hippocampus.
Hippocampal slices were prepared from Wistar rats (A) and NER (B) (n = 10). The lower panel show the density of Timm’ stain, which was measured by using Multi Gauge V3.1, in the stratum lucidum where mossy fiber terminals exist. As a representative sample (circle) in Fig. 1A, five regions of interest per slice were set in the stratum lucidum and the densities measured were averaged. Each bar and line (mean ± SEM) represents the rate (%) of the density of Timm’ stain of Wistar rats to that of NER, which was represented as 100%.

