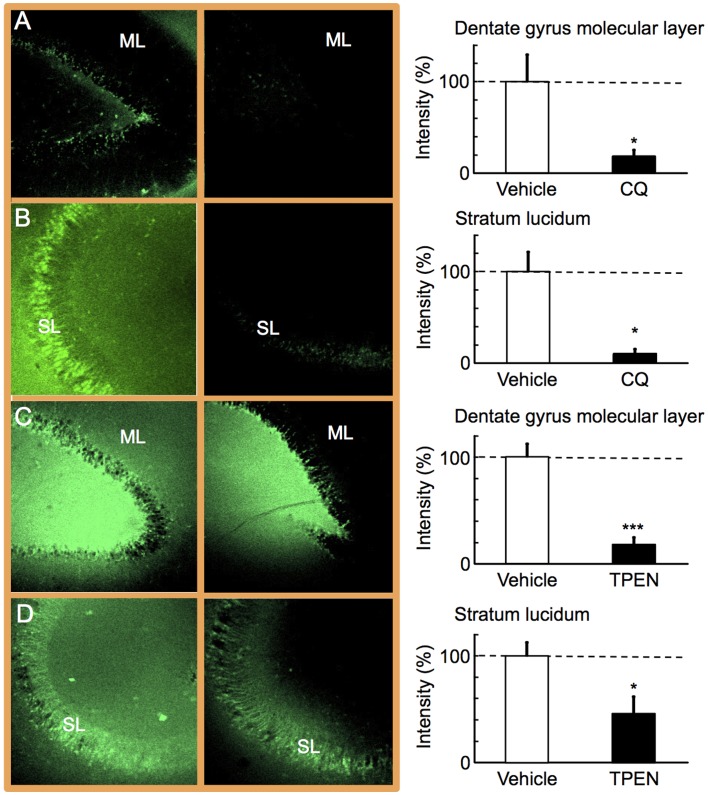
Figure 4. Decrease in extracellular Zn2+ in the hippocampus by zinc chelators.
Hippocampal slices were prepared 2 h after i.p. injection of vehicle (A, n = 7) or CQ (30 mg/kg, B, n = 5) into NER, and 3 h after i.p. injection of vehicle (C, n = 7) or TPEN (1 mg/kg, D, n = 8) into NER. The hippocampal slices were imaged with ZnAF-2 (left side). To evaluate the effects of CQ (the left image of A and B, vehicle; the right image of A and B, CQ) and TPEN (he left image of C and D, vehicle; the right image of C and D, TPEN), CQ-injected (A and B) and TPEN-injected (C and D) groups were separately measured under the exactly same condition. The measurement condition was slightly different between CQ and TPEN groups for the optimal imaging of the decrease in Zn2+ by fluorescence intensity. Region of interest was set the area surrounding the abbreviated letters, i.e., ML and SL, where zincergic (glutamatergic) synapses exist. ML, the molecular layer of the dentate gyrus (A and C). SL, the stratum lucidum of the CA3 (B and D). The data (mean ± SEM) represent the rate of ZnAF-2 intensity after zinc chelator injection to that after vehicle injection, which was expressed as 100% (right side).

