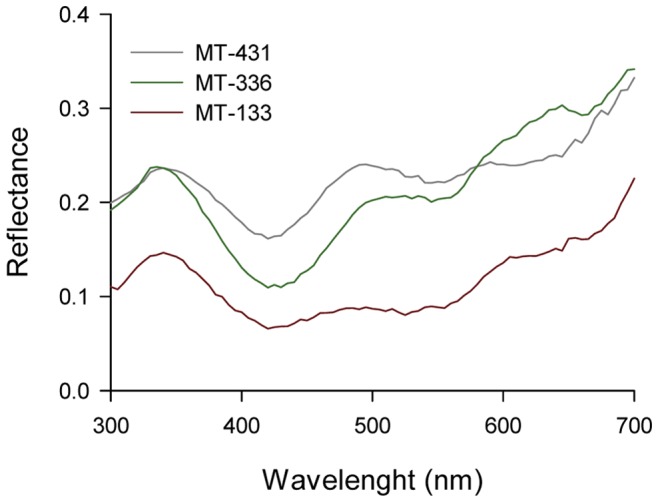
Figure 1. Spectral reflectance curves of the stimuli and background.

Spectral reflectance of the grey background (Canson MT-431) and the two coloured stimuli (MT-336 and MT-133) in the 300–700 nm range.

Spectral reflectance of the grey background (Canson MT-431) and the two coloured stimuli (MT-336 and MT-133) in the 300–700 nm range.