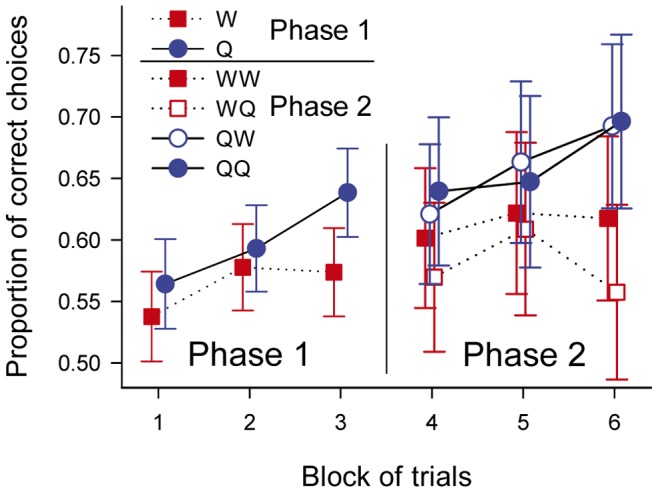
Figure 5. Learning performance.

Average proportion of correct choices (estimated for the mean choice latency) over a block for bees which had water (red squares) and quinine (blue circles) as the negative reinforcer (US-1) during phase 1. For blocks 4–6, filled symbols correspond to bees which had the same reinforcer in phases 1 and 2 of the experiment, and empty symbols to bees which had different reinforcers. Error bars denote 95% confidence intervals.
