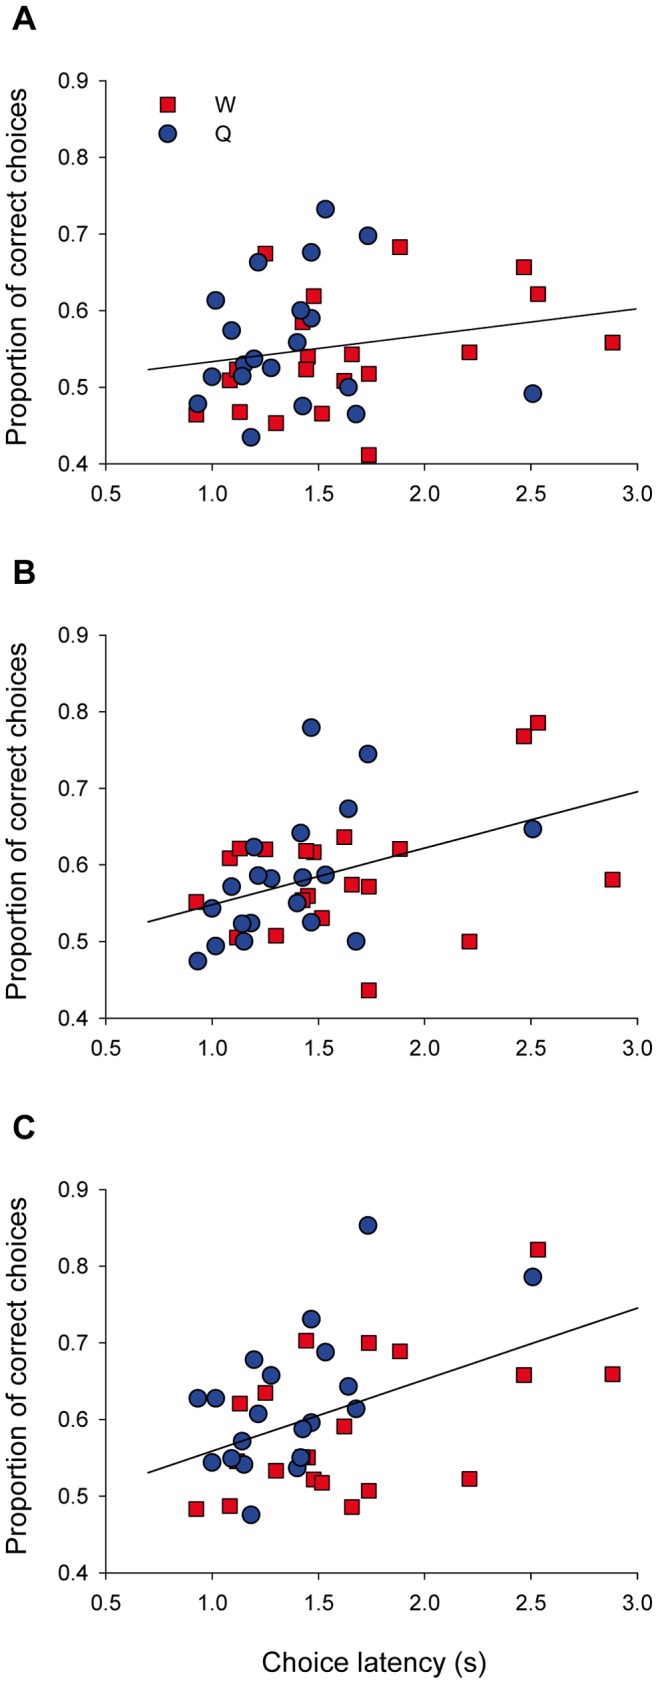
Figure 6. Relationship between choice latency and performance during phase 1.

Each dot represents the choice latency and performance for an individual bee. Latencies are calculated as the averages of those measured in trials 14 and 29. Performance is the proportion of correct choices over a block, for (A) block 1 (trials 1–5), (B) block 2 (trials 6–10) and (C) block 3 (trials 11–14). Symbol type indicates whether bees experienced water (red squares) or quinine (blue circles) as negative reinforcer during phase 1. Note the increase in the slope of the regression line as we move from A to C.
