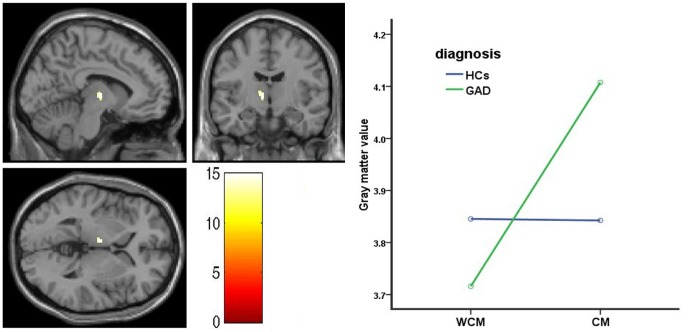
Figure 1. The diagnosis-by-maltreatment interaction effect in the left thalamus.
Left: Statistical parametric map depicting interaction effect in the left thalamus (p < 0.05, FWE corrected). Color scales represent F-values. Right: The interaction graph showing left thalamic gray matter volume differences between the groups, in which adolescent GAD patients with childhood maltreatment have more gray matter volumes in the left thalamus than those without childhood maltreatment and both HCs. GAD, generalized anxiety disorder, HCs, healthy controls, CM, childhood maltreatment, WCM, without childhood maltreatment.

