
Figure 2. Boxplot of dictator donations (proportion of endowment given to receiver) according to stake size for Indian players.
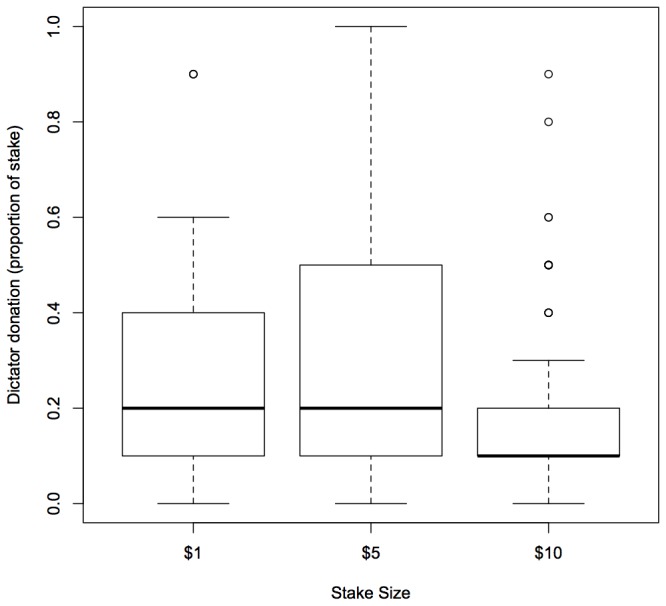
Solid lines represent medians while the upper and lower boundaries of the box are the upper and lower quartiles of the data. The highest and lowest values in the data (excluding outliers) are indicated by the bars extending from the boxes. Circles represent outliers.