
Figure 2. Effect of Us3 kinase activity on cell surface expression of MHC-I, gD and gH in HSV-1-infected MRC-5 cells.
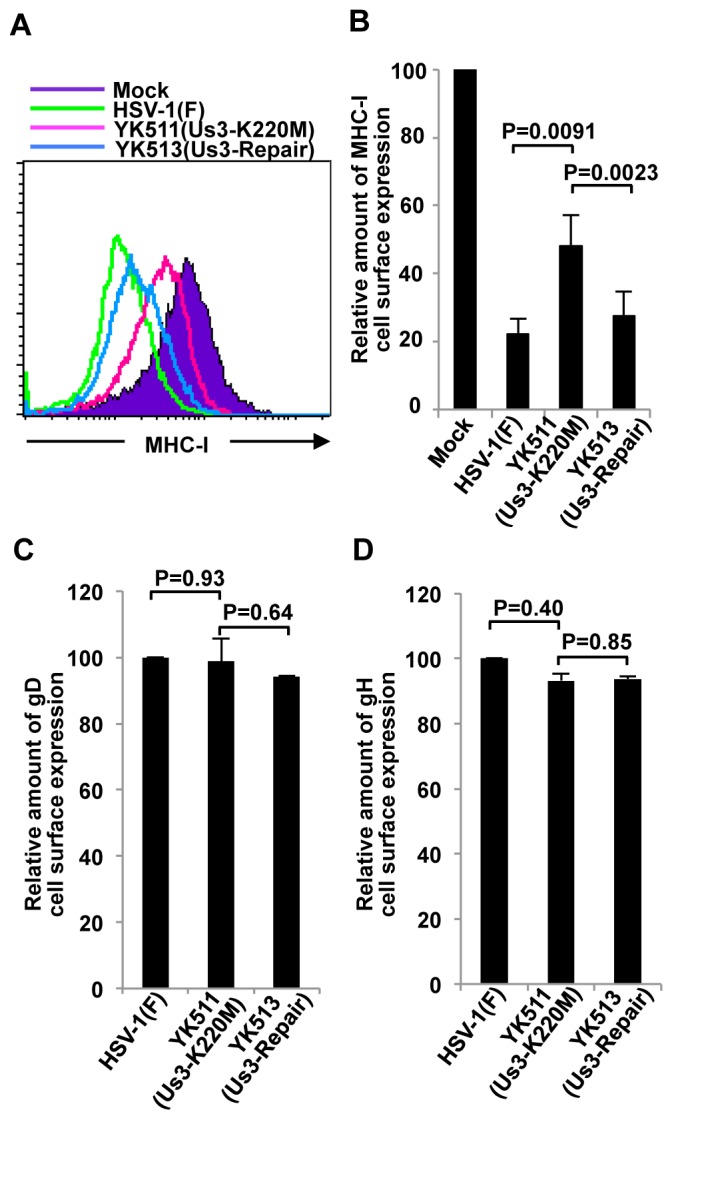
(A) Cell surface expression of MHC-I in human MRC-5 cells mock-infected (filled purple histogram) or infected with wild-type HSV-1(F) (green line), YK511 (Us3-K220M) (pink line) or YK513 (Us3-repair) (blue line) at an MOI of 3 for 18 h and analyzed by flow cytometry. The data are representative of five independent experiments. (B) Quantitation of cell surface expression of MHC-I in infected MRC-5 cells. The relative mean fluorescence intensity (MFI) for MHC-I expression on the surface of cells infected with the indicated virus is shown as the fluorescence intensity of virus-infected cells relative to that of mock-infected cells. Each data point is the mean ± standard error of five independent experiments. (C and D) Surface expression of gD (C) and gH (D) in MRC-5 cells infected with HSV-1(F), YK511 (Us3-K220M) or YK513 (Us3-repair) at an MOI of 3 for 18 h and analyzed and quantitated as described in Figure 2B. Each data point is the mean ± standard error of triplicate samples, and is representative of three independent experiments.