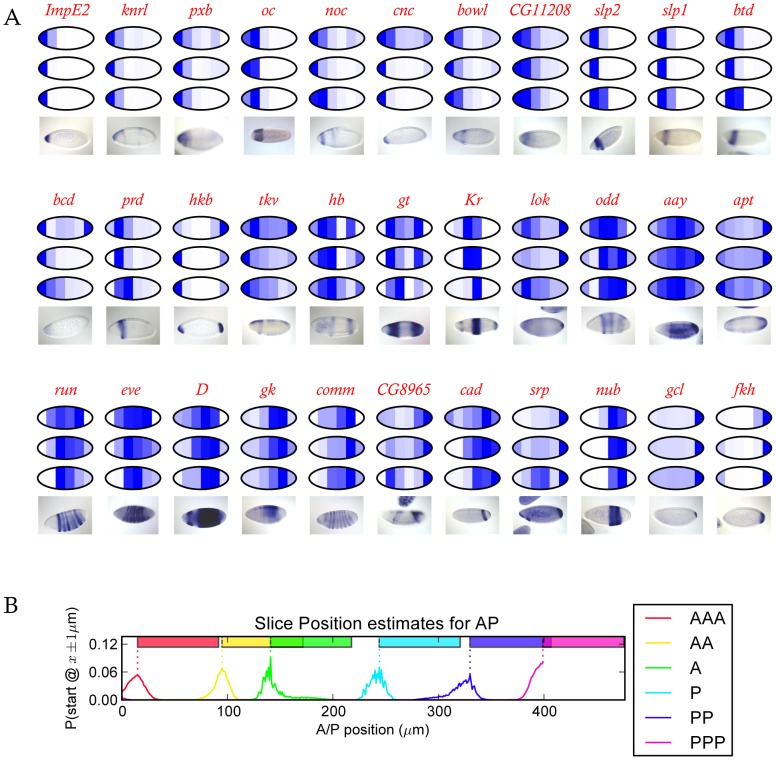
Figure 1. Expression in the slices closely matches published expression data.
(A) Published in situ patterns for 33 genes are shown alongside reconstrucred spatial patterns for these genes from each of the three 60 µm sliced CaS embryos. The reconstructed patterns were each scaled to the slice with the highest expression level for each embryo individually. (B) To evaluate the overall quality of our reconstructed spatial expression patterns, we compared expression levels of 98 genes from each slice in our 60 µm data (averaged across the three embryos) to all possible 60 µm sections from a cellular resolution spatial atlas of gene expression from the Berkeley Drosophila Transcription Network Project [1] with absolute expression levels computed using data from [5]. We computed the posterior probability that a slice from our data corresponded to a slice from the BDTNP atlas using a simple Bayesian procedure that compares the level of each gene in a slice to the level of that gene in sections of the atlas. The line graphs are the posterior probabilities that each slice started at a given position in the atlas. Each slice has a clear peak and the ordering of the peaks corresponds to the ordering of the slices, as expected. The colored bars show the portion of the embryo spanned by the slice assuming it begins at the peak in the posterior probability distribution.

