
Figure 3. Expression of key patterning genes across early development.
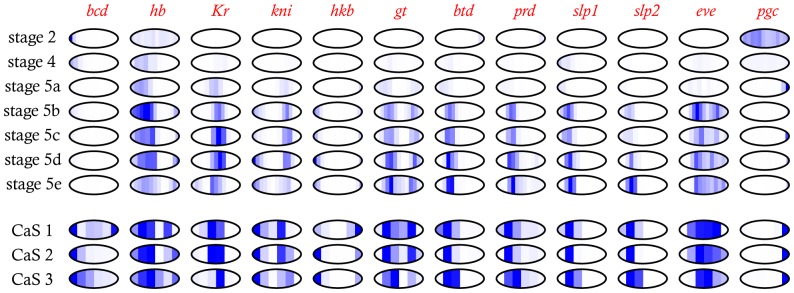
Expression levels in the 25 µm timeseries are normalized to the highest expression level at any time pioint. For slices with poor quality data (timepoint 4, slice 10; timepoint 6, slice 6; timepoint 7, slice 7; and timepoint 7, slice 8) data imputed from neighboring slices is shown. Expression levels for the 60 µm slice samples are normalized to the highest level in each embryo.