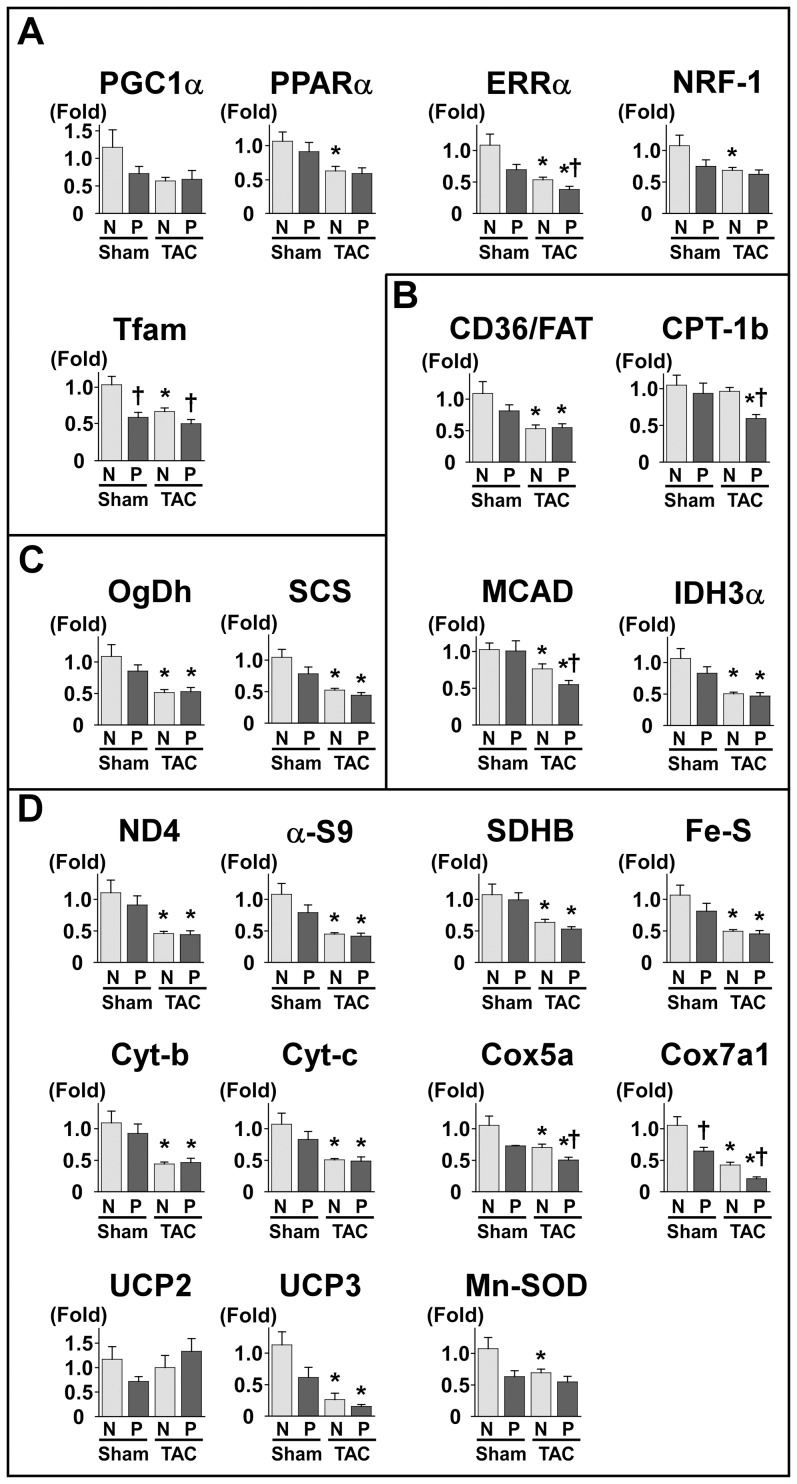
Figure 10. The expression of genes related to mitochondrial function under the TAC operation.
The expression of genes related to mitochondrial energy metabolism was decreased in NTg mice with TAC. The genes presented here are (A) transcriptional regulators, (B) fatty acid metabolism, (C) the TCA cycle, and (D) mitochondria. Pgam2 overexpression further decreased the expression of some of these genes, such as ERRα, Tfam, MCAD, Cox5a, and Cox7a1 with TAC. Values are the mean ± SEM. N: NTg mice. P: Pgam2 mice. *p<0.05 versus the same genotype with the sham operation. †p<0.05 versus NTg mice with the same operation. Sham-operated NTg mice: n = 8; sham-operated Pgam2 mice: n = 8; NTg mice with TAC: n = 10; Pgam2 mice with TAC: n = 14.

