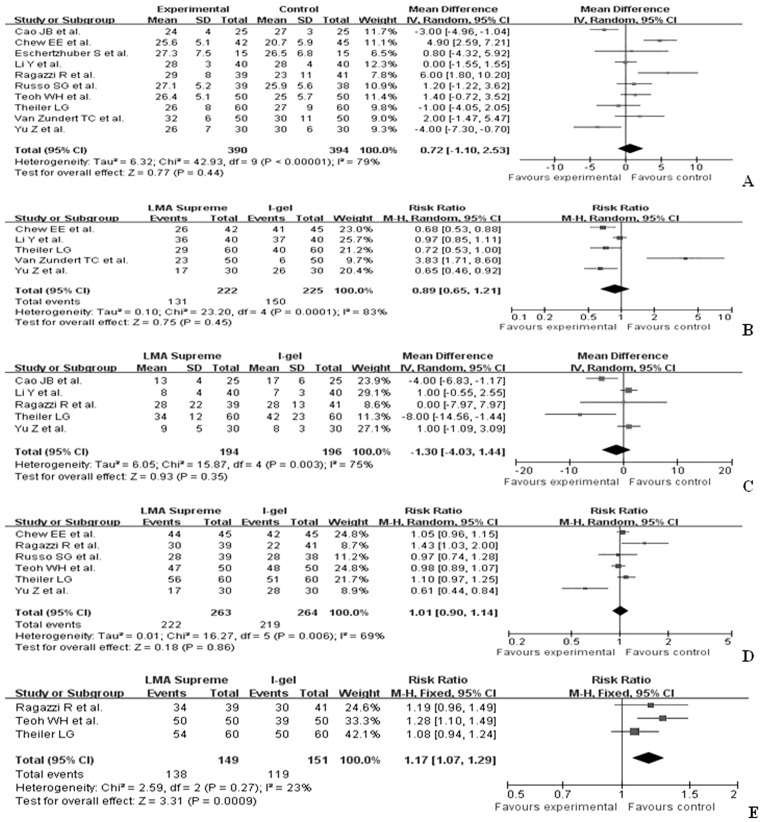
Figure 2. Forest plot displaying the pooled summary performance of the LMA-Supreme™ versus the i-gel™: A) oropharyngeal leak pressure, B) grade 3 and 4 fiberoptic view, C) device insertion time, D) first attempt insertion success, E) ease of gastric tube insertion.
SD = standard deviation; IV = weighted mean difference; CI = confidence interval; df = degrees of freedom; Chi2 = chi-square statistic; p = p value; I2 = I-square heterogeneity statistic; Z = Z statistic; RR = risk ratio; WMD = weight mean difference.

