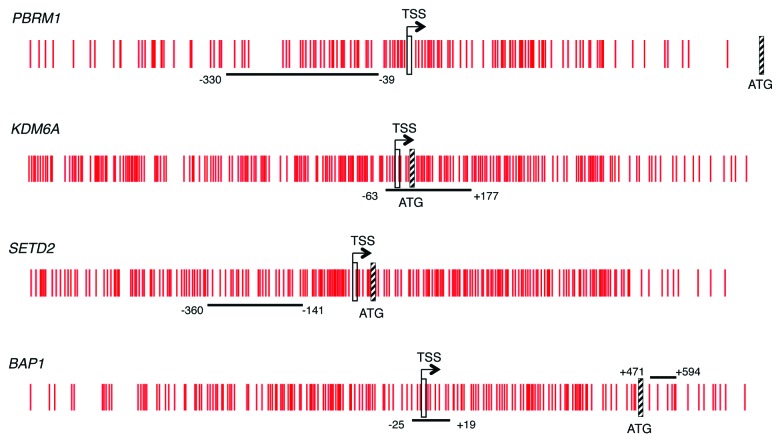
Figure 1. CpG island schematic of the genes studied. Vertical red lines represent individual CpG loci in the island. The TSS is indicated by a vertical rectangle and the ATG by a hatched box. The horizontal black line indicates the area sequenced and the nucleotide position given is relative to the location of the TSS from Ensembl.

An official website of the United States government
Here's how you know
Official websites use .gov
A
.gov website belongs to an official
government organization in the United States.
Secure .gov websites use HTTPS
A lock (
) or https:// means you've safely
connected to the .gov website. Share sensitive
information only on official, secure websites.
