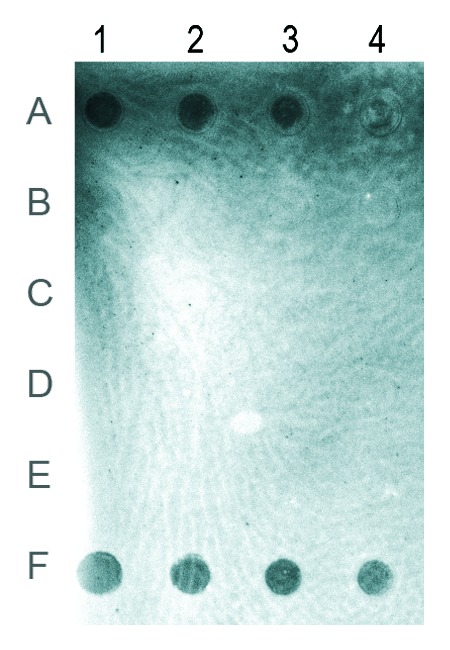
Figure 2. Immuno-dot blot using antibody specific for 5-methylcytosine. Rows (A) to (D) represent genomic DNAs from embryos, larvae, pupae and adults, respectively. Row (E), unmethylated DNA used as a negative control. Row (F), 5-methylcytosine DNA used as a positive control. The amount of genomic DNA in the dots of columns 1–4 was 100, 50, 25 and 12.5 ng. The brightness of the image was modified using the Curve function in Photoshop.
