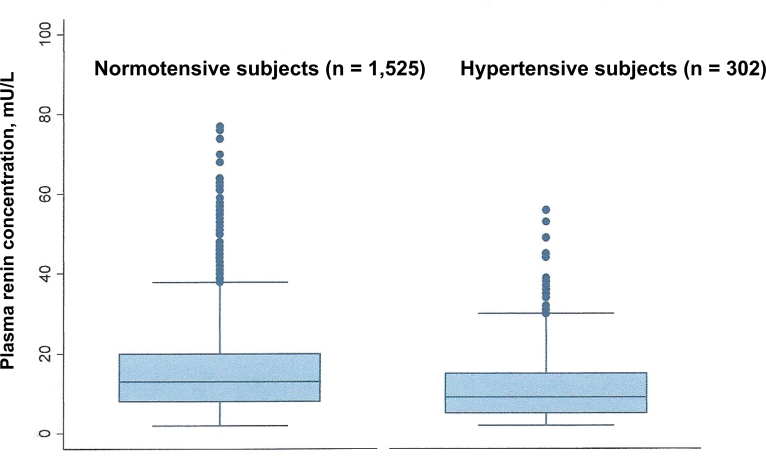
Figure 2.
Box plots showing the plasma renin concentrations in the normotensive and hypertensive subjects. The horizontal lines above and below the box (whiskers) show the lower and upper values that are the furthest observations within 1.5 times the interquartile range of the lower and upper ends of the box. The mean renin concentration in normotensive subjects was 15.9 mU/L; the mean renin concentration in hypertensive subjects was 12.7 mU/L. The mean difference between normotensive and hypertensive subjects was 3.2 mU/L (95% confidence interval = 1.2–5.0; P = 0.001). Four normotensive and 1 hypertensive subject with renin >100 mU/L are not shown.

