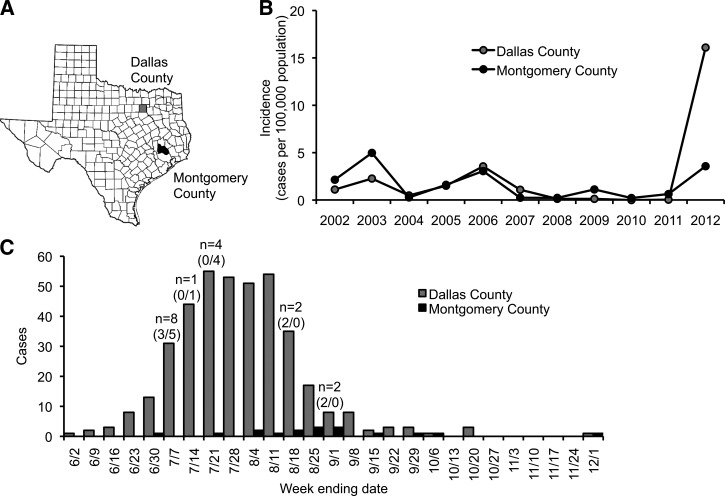
Figure 1.
West Nile virus (WNV) disease incidence in Dallas and Montgomery Counties in 2012. Dallas and Montgomery Counties are highlighted in gray and black, respectively. (A) Map of Texas counties. (B) Annual incidence, reported as total West Nile fever (WNF) and West Nile neuroinvasive disease (WNND) cases per 100,000 populations. (C) Epidemic curve for total WNF and WNND cases in 2012. Numbers above bars represent the combined number of mosquito pool collections made in both Dallas and Montgomery Counties for this study, with numbers in parentheses representing the number of mosquito pool collections made in each county (Dallas/Montgomery).

