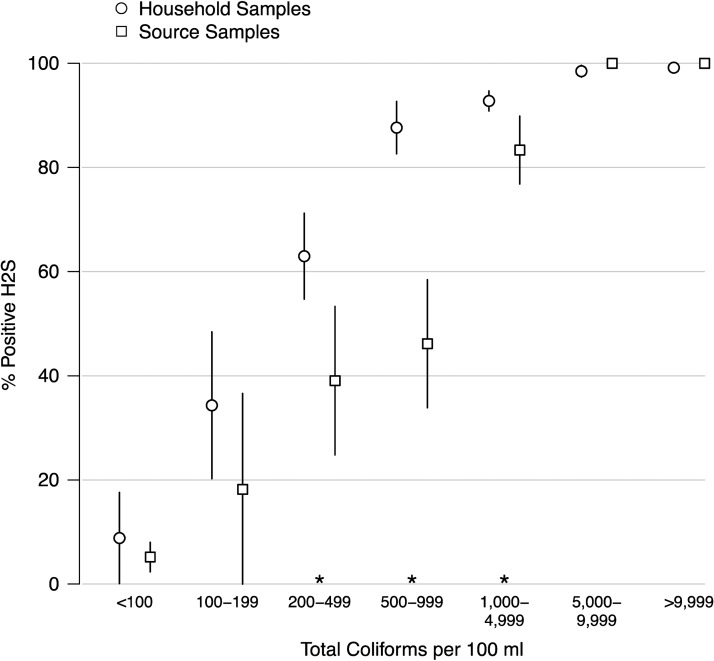
Figure 2.
Percent positive H2S tests by total coliform concentration for household and village source samples. Vertical lines are robust 95% confidence intervals. Asterisks (*) mark statistically different means between household and village source samples at the 95% confidence level. N = 3,026 household samples; N = 695 village source samples.

