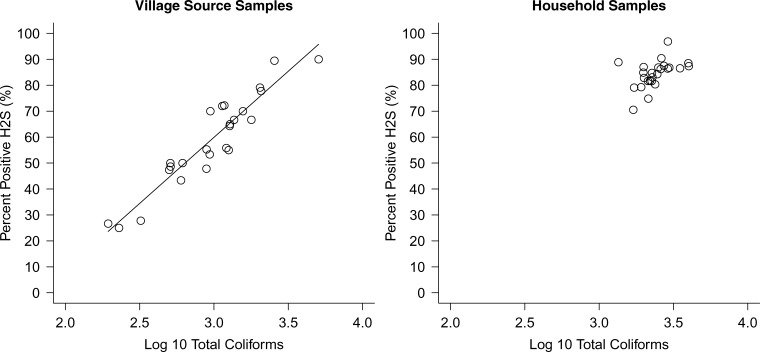
Figure 3.
Relationship between the percentage of H2S positive tests and log10 total coliform concentration for village source samples (left) and household samples (right) using mean concentrations at the village level. N = 695 village source samples; N = 3,026 household samples. The fitted line in the village source samples is a weighted least squares fit with parameters H2S = −92.9 + 51.0 × log10TC, R2 = 0.87. The parameters fit including both village (left) and household samples (right) was similar: H2S = −90.2 + 51.3 × log10TC, R2 = 0.81, and the fit was not greatly improved using a logistic instead of linear model.

