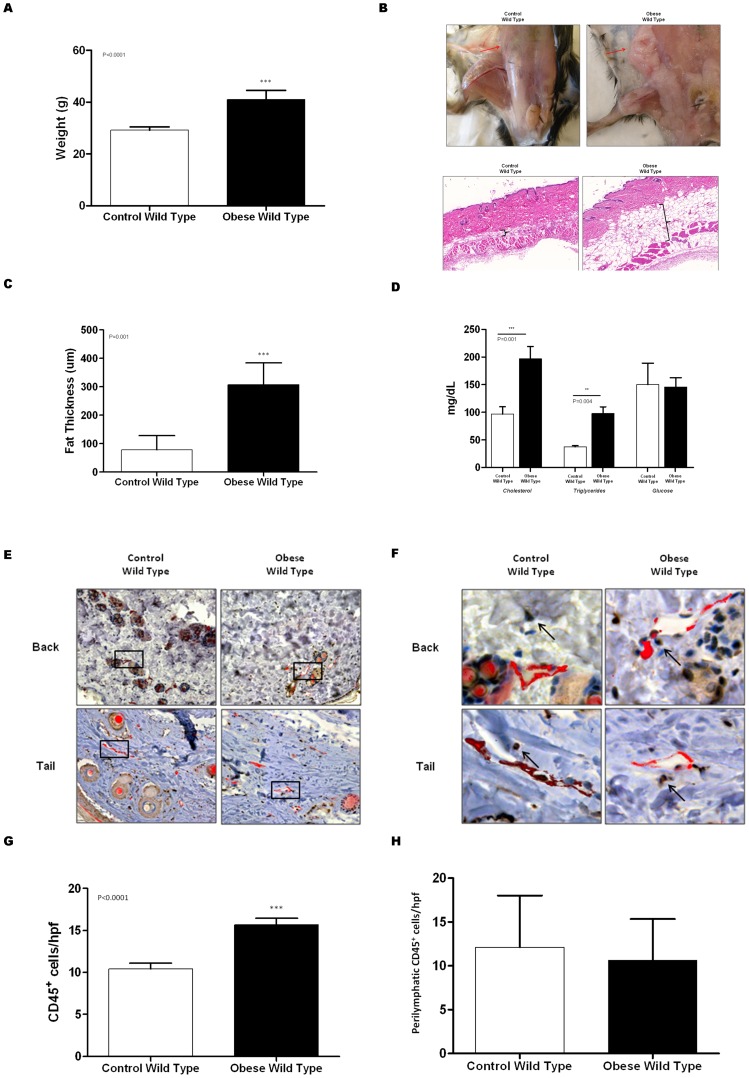
Figure 1. High fat diet results in obesity and subcutaneous tissue inflammation.
A. Body weight of obese and control mice. B. Gross photograph of subcutaneous tissue adipose deposition in control and obese mice (top). Representative photomicrograph of full-thickness back punch biopsy specimens in control and obese mice (20× magnification). Brackets indicate subcutaneous fat deposition. C. Mean subcutaneous fat thickness in back punch biopsy of control and obese mice. D. Serum cholesterol, triglycerides, and glucose levels in 12 hour fasting blood samples from control and obese mice. E., F. Representative low (E; 10x) and high (F; 40x) power photomicrographs of control and obese mice back punch (upper) and tail (lower) histological sections stained for CD45 (brown) and LYVE-1 (red). Black box in figure E is magnified in F. G. Mean number of CD45+ cells/hpf (40x) in control and obese mice. H. Mean number of peri-lymphatic CD45+ cells/hpf (40x) in control and obese mice.

