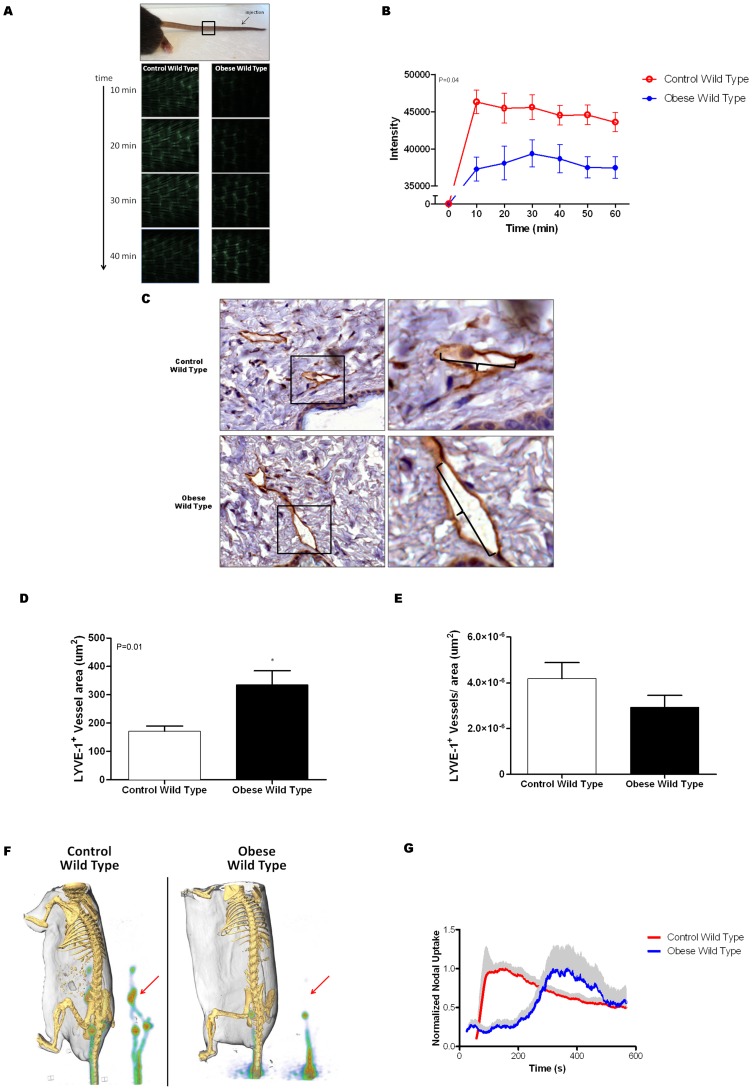
Figure 2. Obesity impairs lymphatic flow.
A., B. Representative florescent photomicrograph of microlymphangiography (A) and quantification of florescence intensity at a fixed distance from the injection site (black box on photograph; B) in control and obese mice. The microlymphangiography photographs depict the uptake of florescent labeled macromolecule in the dermal lymphatics of the tail at various time points following injection in the distal tail. Note rapid uptake (10 minutes) and increased florescence intensity in control mice as compared with obese mice. This difference is quantified in figure B in 5 animals per group. C. Representative low power (20x; upper) and higher power (40x; lower) photomicrographs of back punch tissue sections from control and obese mice stained for LYVE-1 (brown). Boxes in upper panel represent area magnified in high power views. Brackets denote diameter of the lymphatic vessels. D. Mean lymphatic vessel area in control and obese mice. E. Mean number of LYVE-1+ lymphatic vessels/hpf in back punch biopsies of control and obese mice. F., G. Representative PET-CT of control and obese mice demonstrating lymphatic chain after distal tail injection of 18F-FDG. The lymphatic chain is also shown separately for greater detail. Arrow denotes location of para-aortic lymph nodes. Mean normalized sacral node uptake ± SEM (gray shading) of 18F-FDG over time in control and obese mice.

