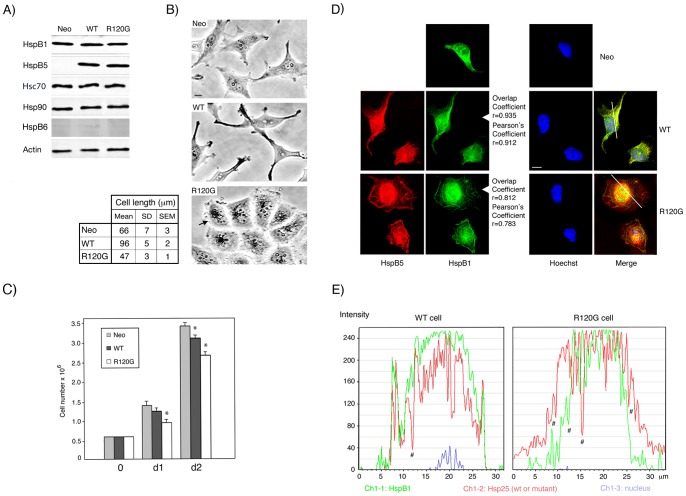
Figure 1. Characterization of Neo, WT and R120G cells.
A) Immunoblot analysis of total cellular extracts of Neo, WT and R120G HeLa cells. The levels of HspB1, HspB5, Hsp70, Hsp90, HspB6 and Actin were detected in immunoblots probed with the corresponding antibodies (see Materials and Methods). B) Phase contrast analysis of Neo, WT and R120G. bar: 10 µm. Black arrows: perinuclear granules; white arrowheads: membranous ruffles. Analysis of the biggest dimension of cells (cell length) is presented in the adjacent figure. Mean, SD (standard deviation) and SEM (standard error of mean) of twenty different measurements are presented. C) Analysis of the number of cells in the cultures was from day 0 to days 1 and 2 (d1, d2). Values are means ± SEM of three independent experiments. One-way ANOVA within a time point analysis indicates statistically significant growth differences between Neo and WT and R120G cell lines, *P<0.05. D) Immunofluorescence analysis. Neo, WT and R120G cells were processed for the immunofluorescence detection of HspB5, HspB1 and nuclei as described in Materials and Methods. Bar: 10 µm. Cells were stained for HspB5 (red fluorescence), HspB1 (green fluorescence), nuclei (blue fluorescence) and processed as described in Materials and Methods. The fusion images (Merge) of WT and R20G cells are shown. Overlap and Pearson's coefficients are indicated. E) The graphs represent the fluorescence distribution of HspB1 (green; Ch1-1), wild type or mutant HspB5 (red; Ch1-2) and nucleus (blue; Ch1-3) of the section of WT or R120G cells shown in the green/red fusion images (Merge). #: areas where the co-localization of HspB1 and HspB5 (wild type or mutant) may not occur.

