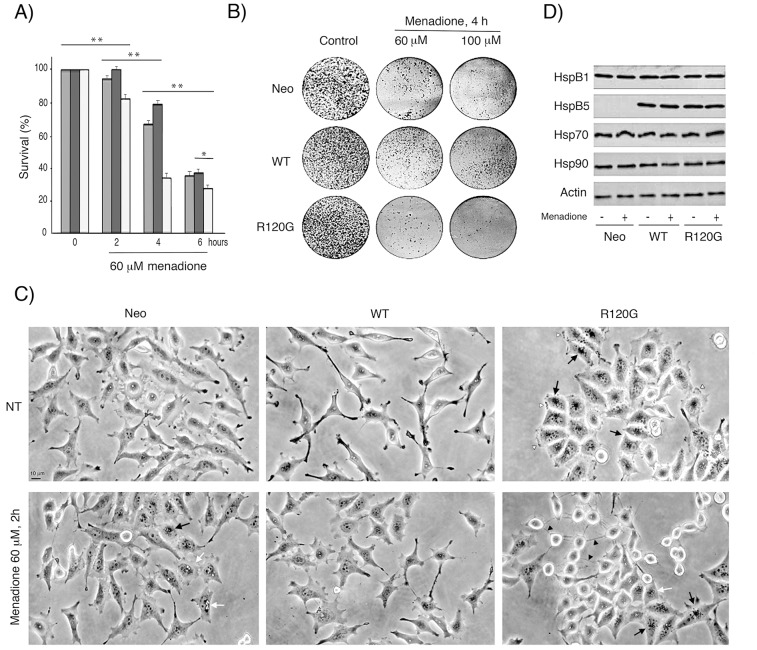
Figure 3. Enhanced oxidoresistance induced by wild type HspB5 and sensitivity mediated by the R120G mutation.
Neo, WT or R120G cells were treated or not for different time periods with several concentrations of menadione. A) Crystal violet staining. The percentage of cell survival corresponded to the ratio of the relative absorbance of the different samples to that of untreated cells. Values are means ± SDM of three independent experiments. 2-way ANOVA indicates statistically significant differences in the survival to menadione treatment between Neo, WT and R120G cell lines, *P<0.05, **P<0.01. B) Clonogenic colony formation assay. The number of colonies was visually estimated. All experiments were performed in triplicate. C) Phase-contrast analysis of cell morphology. Before and after treatments, phase contrast analysis of the morphology of live cells was performed and photographs are presented. Bar: 10 µm. Black arrows: perinuclear granules; black arrowheads: filamentous bridges between cells; white arrowheads: membranous ruffles; white arrows: vacuoles. D) Immunoblot analysis of the level of HspB1, HspB5, Hsp70 and Hsp90 in menadione-treated Neo, WT and R120G cells.

