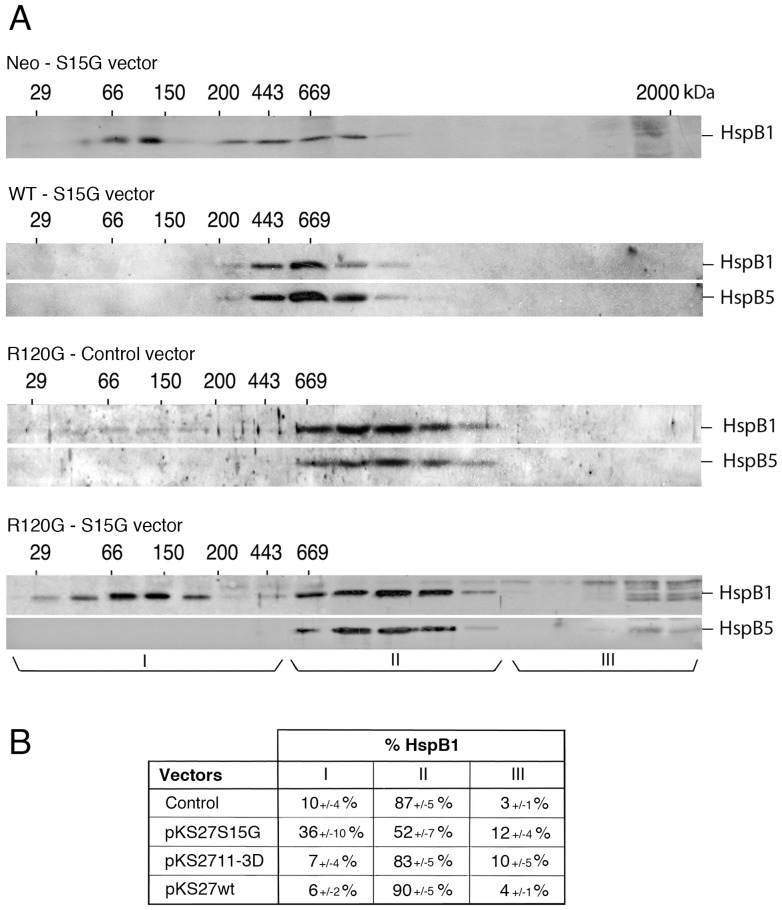
Figure 7. Effect of HspB1 serine 15 phosphorylation on HspB1-HspB5 native size.
A) Neo, WT and R120G cells were transiently transfected with pKS27S15G vector (phosphoserine 15 of HspB1 replaced by glycine, S15G vector; see Materials and methods) and HspB1 as well as HspB1/HspB5 native sizes were subsequently analyzed as described in Fig. 5. Results obtained from R120G cells transiently transfected with the corresponding empty vector are also presented (control vector). Three size domains (I, II, and III) were defined in the R120G column fractions that corresponded to the h, i and j fractions indicated in Fig. 5 and 6. Autoradiographs of ECL-revealed immunoblots are presented. 29, 66, 150, 200, 443, 669 are gel filtration markers. Exclusion size of the column is 2000 kD. B) Quantitative analysis. The distribution of HspB1 between size domains I, II and III of transiently transfected R120G cells is shown and expressed as percentage of the HspB1 content in the 10,000×g supernatant loaded on the column. The following vectors were used: pKS control, pKS27S15G (phosphoserine 15 of HspB1 replaced by glycine), pKS2711-3D (the three phosphoserine sites of HspB1 replaced by aspartic acid) and pKS27wt (wild type HspB1). Standard deviations are indicated from three independent experiments.

