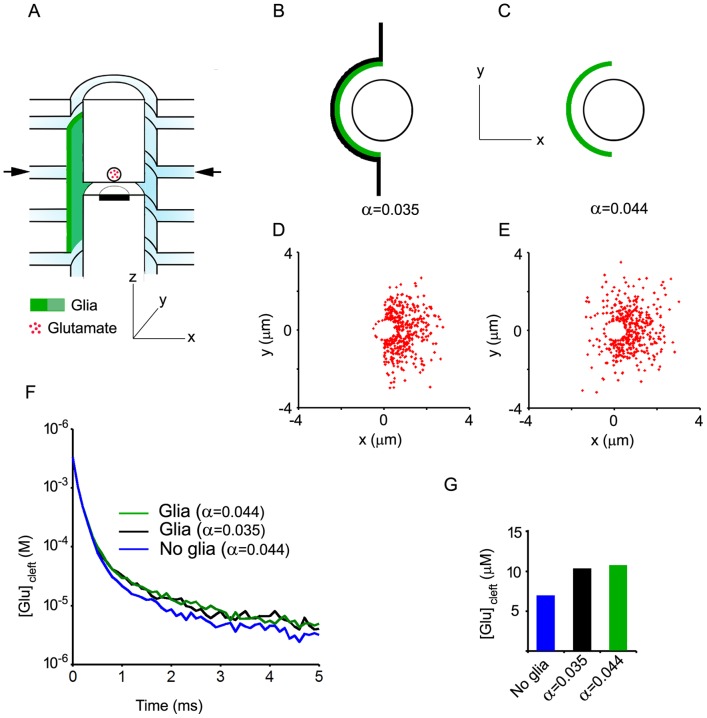
Figure 2. Effects of diffusion barriers.
A, B and C depict the two conditions tested. In both conditions, proximal escape routes are partially obstructed by glial barriers (green). Arrows in A indicate the level of the top views shown in B and C. In B, diffusion barriers also extend within the escape routes thereby reducing the volume of the extracellular space available for diffusion (α = 0.035). In C, glial barriers are present around the axon and the dendrite (one half of the ADI perimeter covered) but do not extend within escape routes. Glutamate molecules must walk round the glial barriers to access the whole extracellular space but the actual porosity is not modified (α = 0.044, as in the no glia conditions). D and E. Snapshots of glutamate diffusion in the x-y plane indicated by arrows in A. They were obtained 1 ms after release using the glial barrier arrangements depicted in B and C, respectively. F. Time course of glutamate in the synaptic cleft in control conditions (no glia, blue) and with the glial barriers depicted in B (α = 0.044, green) and C (α = 0.035, black). Each trace is the average of 10 independent trials. G. Cleft glutamate concentrations averaged between 1 and 5 ms after release (means of 10 trials) with or without glial barriers. The two glial arrangements tested induce similar increases in cleft glutamate concentrations suggesting that they are functionally equivalent, at least within this time window.

