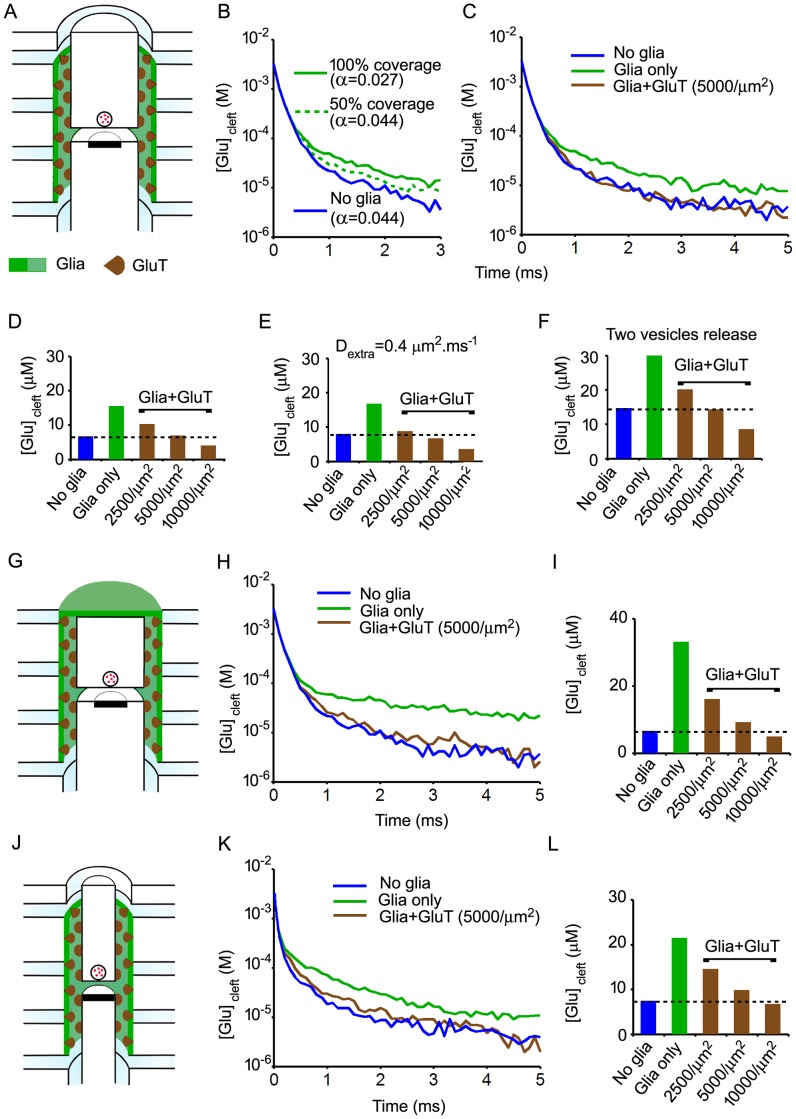
Figure 3. Effects of diffusion barriers and uptake on the time course of glutamate in the synaptic cleft.
A. Three-dimensional representation of the model showing the localisation of glia and transporters (half view, not to scale). B. Time course of cleft glutamate concentrations without glia (blue curve) and with glial sheets surrounding either half of the ADI perimeter (50% coverage, green dashed curve) or the full ADI perimeter (100% coverage, green solid curve). C. Time course of cleft glutamate concentrations without glia (blue), with glial barriers (full ADI coverage) but without glutamate transporters (glia only, green ) and with both glial barriers and glutamate transporters (“Glia+ GluT”, brown). Each trace is the mean of 5 independent trials. D. Cleft glutamate concentrations averaged between 1 and 5 ms after release (means of 5 trials) with or without glia (full ADI coverage) and/or transporters. E. Same as in D but with coefficients of diffusion in the cleft and the extra-synaptic extracellular space set to the same value (0.4 µm2.ms−1). F. Same as in D but with simultaneous release of two vesicles (6000 molecules of glutamate released). G. Model with complete glial capping (half view, not to scale). H. Time course of cleft glutamate concentrations obtained using the model shown in G I. Cleft glutamate concentrations averaged between 1 and 5 ms after release (means of 5 trials). J. Model without non-synaptic ADI (half view, not to scale). K. Time course of cleft glutamate concentrations obtained using the model shown in J. L. Cleft glutamate concentrations averaged between 1 and 5 ms after release (means of 5 trials). Whatever the characteristics of the synapse, the amount of glutamate released and the disposition of glia, uptake by realistic glutamate transporters densities (5000/µm2 to 10000/µm2) compensate for the effect of diffusion barriers.

