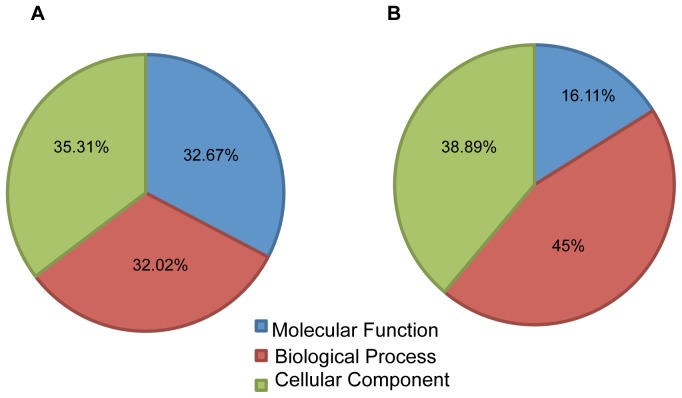
Figure 3. Gene Ontology analysis.
The figure represents the pie chart view of the GO analysis performed by Genespring GX 10.0.2. The percentages represent statistically significant (p<0.1) genes that match each GO term. The pie chart sections represent GO terms biological processes, cellular components and molecular functions. The GO analysis gives a broad overview of the biological significance of the differentially regulated genes. Figure (A) represents differentially regulated genes by PAK1 whereas (B) represents differentially expressed genes regulated by Pak1 that were responsive to IR.

