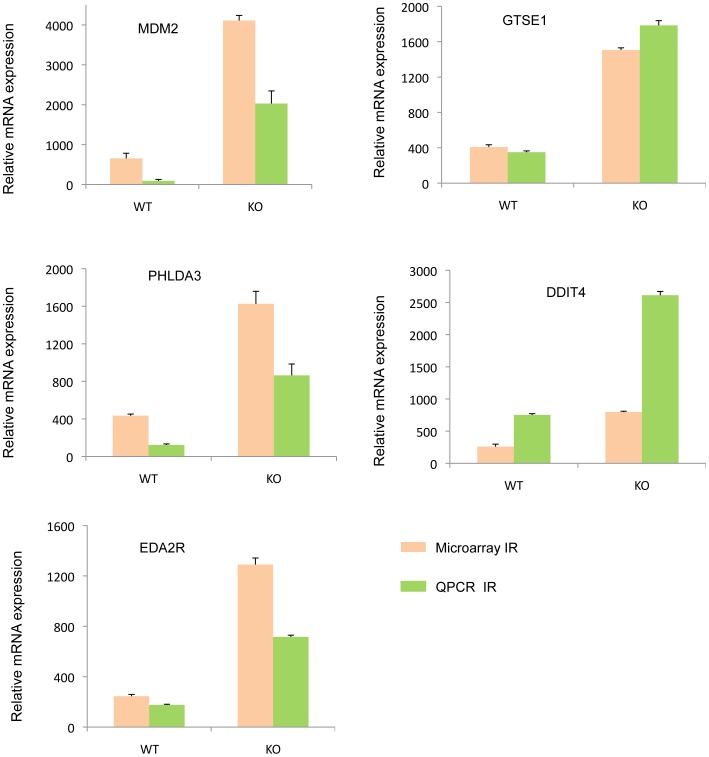
Figure 10. Microarray validation of targets regulated by PAK1 and responsive to IR.
The RT-qPCR was performed in duplicates for each of the triplicate WTIR and KOIR RNA sample. The WT and Pak1-KO RNA samples from MEFs were subjected to ionizing radiation. The relative mRNA expression is represented in the figure and the p-values were computed. The orange bars show the expression data from Microarray whereas the green bars represent expression levels obtained by q-PCR. The Ct values of the genes were normalized with the Ct values of 18S.

