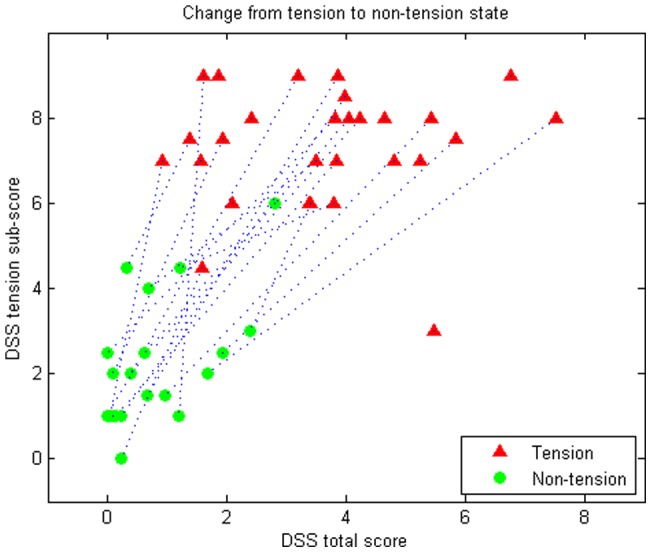
Figure 1. DSS total scores and tension sub-scores for tension and non-tension state.

Scores are averages over the two observations in each state. The dashed line represents the patients and the two states of each patient.

Scores are averages over the two observations in each state. The dashed line represents the patients and the two states of each patient.