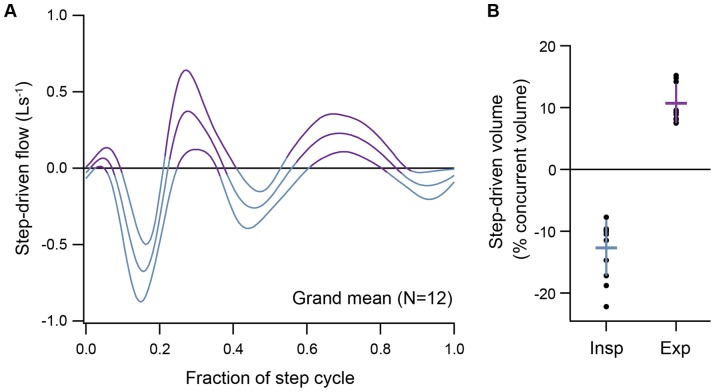
Figure 2. Step-driven ventilatory flows and volumes.
(A) Grand mean of step-driven ventilatory flow across subjects (mean ± 95% confidence interval for 12 subjects, see also individual examples in Fig. 5). Expiration is positive. (B) Mean ± SD of step-driven volume as a percentage of total concurrent ventilatory volume (Vtot), during level moderate speed running (N = 12, black dots show data from individuals). Step-driven flow and volume data included here are from subjects with variation in the phase locking between steps and breaths ( Table 1 ).

