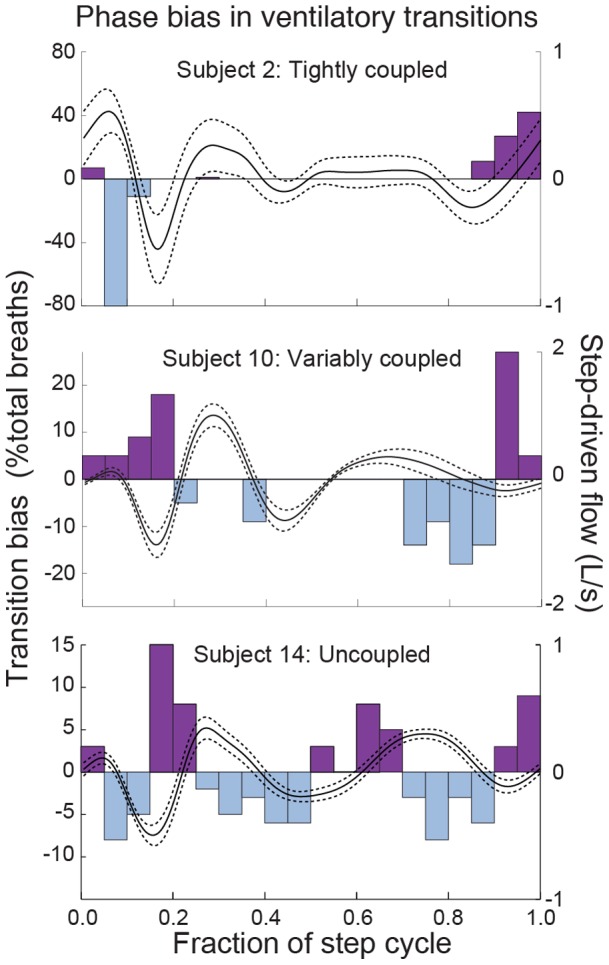
Figure 5. Subjects prefer to initiate ventilatory transitions at phases that assist rather than imped flow.

The distribution of ventilatory transitions relative to the step cycle is non-uniform (Table 3). Here we show the net bias in ventilatory transitions relative to step cycle (left axis and bars), with transitions to expiration as positive, transition to inspiration as negative. The ‘net bias’ value is the number of expiratory transitions minus the number of inspiratory transitions in each phase bin. Step-driven flow is overlaid for reference (right axis and lines). Data from 3 individuals illustrates typical variation between strongly coupled (A), variably coupled (B) and uncoupled (C) subjects. Although variation exists, the timing of transitions is clearly non-random, and exhibits some correspondence to the step-driven flow.
