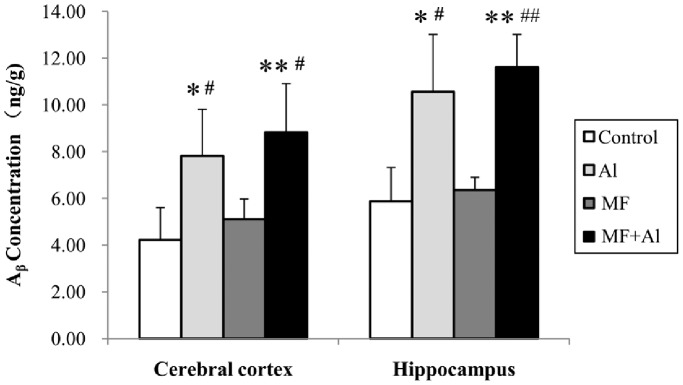
Figure 5. Amounts of amyloid-β (Aβ) deposited in the hippocampus and cerebral cortex.

One-way ANOVA followed by LSD post hoc test showed no significant differences were observed in terms of Aβ concentration in the cortex and hippocampus between the control and MF groups as well as between the Al and MF+Al groups. The same statistical analysis results were obtained by using Kruskal-Wallis H test followed by the Mann-Whitney U test. *P<0.05 vs. Control group, **P<0.01 vs. Control group, # P<0.05 vs. MF group, ## P<0.01 vs. MF group, n = 6 per group.
