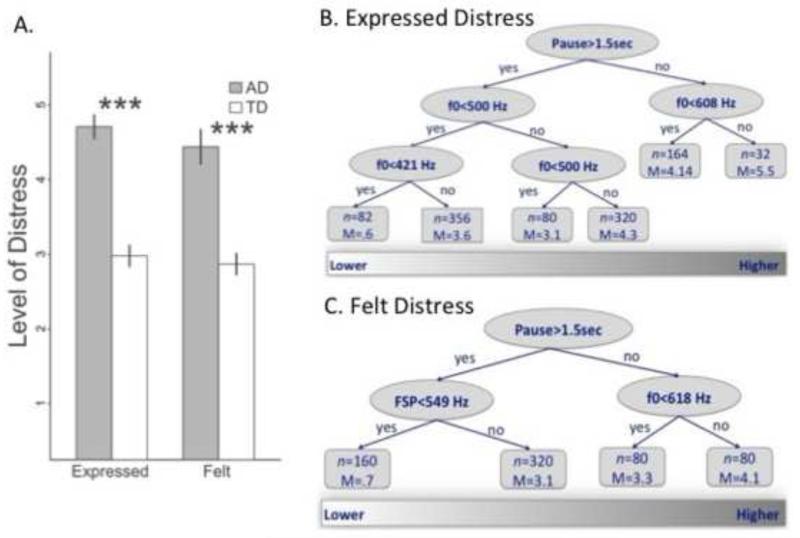
Figure 1A.
Italian sample. Mean levels (± SEM) of judged expressed distress and of felt distress hearing cries of children with AD or TD. ***p ≤ .001. Figure 1B. The optimal tree that predicts expressed distress. The regression tree or tree-based model provides information about (1) the hierarchy of the importance of independent variables in explaining the distribution of the dependent variable and (2) which value of the independent variable divides the dependent variable in two groups that differ statistically. The bottom rectangle shows the distribution of expressed distress from lower (left) to higher (right). The values in the oval leaves of the tree refer to the condition of the independent variable that statistically divides the distribution of the dependent variable. Below each oval leaf, the indications “yes” or “no” refer to whether or not the condition is met. Each leaf is divided in two sub-leaves. The terminal leaves (quadrangles) represent subgroups that cannot be further subdivided. The n value in the terminal leaves represents the size of the group, and M is the mean value of the group for the dependent variable. Figure 1C. The optimal tree for felt distress.

