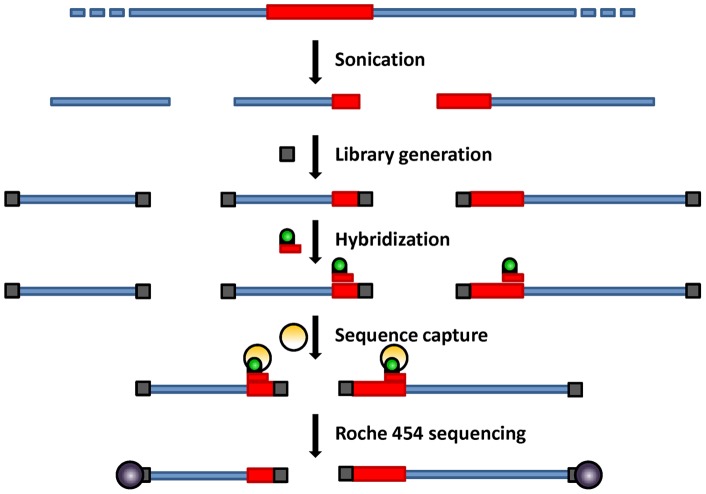
Figure 2. Overview of Targeted Genomic Sequencing.
Blue rectangles represent genomic DNA, and red rectangles correspond to T-DNA insertions. The grey squares represent the 454 specific primers added in order to bind the sequencing beads (purple circles). The green circles correspond to biotin bound to a red T-DNA specific primer and hybridized to T-DNA. Hybridized sequences are then enriched by capture on streptavidin beads (orange circles).

