
Fig. 1.
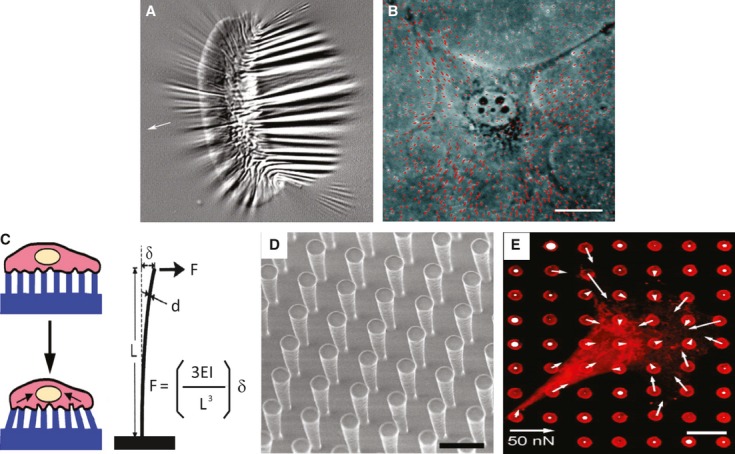
Tools for measuring cellular forces. (A) Fish keratinocytes cultured on a flexible silicon substrate and wrinkling of the film because of the generation of traction in cells. (B) 3T3 cells cultured on polyacrylamide (PA) gel embedded with fluorescent microbeads. Both A and B are reproduced with permission from Ref. 44. (C) Schematic illustration of cells lying on posts and deformation of the posts by exertion of traction force on the posts. (D) A uniform vertical microfabricated elastomeric array of posts. (E) Quantification of the subcellular distribution of traction forces. The length of the arrow indicates the magnitude of the calculated force. C, D and E were reproduced with the permission from Ref. 48.